English
 简体中文
简体中文 繁體中文
繁體中文 日本語
日本語 한국어
한국어 Bahasa Melayu
 Bahasa Indonesia
 Filipino
 ไทย
ไทย Tiếng Việt
 हिन्दी
 العربية
 Italiano
 Português
 Русский
 Español
 Français
 Singapore
 Cambodia
 Myanmar
 Brunei
 Australia
  New Zealand
 Switzerland
 UAE
UAE United States
 Mexico
 Argentina
 South Africa
 IC Markets
 Pepperstone
 AvaTrade
 XM
XM Plus500
 RoboForex
 TMGM
TMGM Exness
 JustMarkets
 Orbex
Orbex Interactive Brokers
 Saxo
Saxo Tiger Brokers
 Binance
 Coinbase
 Gemini Exchange
 Kraken
 iFunds
 IC Funded
 The 5%ers
 TopStep
 IQ Option
 Pocket Option
 RaceOption
 IQCent
A lot of traders install a currency strength meter and still never trade it well. The problem is they treat what is really just a directional filter like a full entry signal, and it shows up in their results.
|
ABOUT THIS GUIDE |
This guide covers what a currency strength meter measures, how to read it, and how to build a complete trading strategy around it. You will learn how to spot the strongest and weakest currencies, pair them for the highest-probability setups, and confirm each signal before entering. An embedded meter below lets you apply the method right now. |
|
QUICK ANSWER |
A currency strength meter ranks the 8 major currencies from strongest to weakest by measuring each currency’s percentage change across all its pairs. Traders use it to pair the strongest currency against the weakest, creating a directional bias. That bias then gets confirmed on the chart with trend direction and a candlestick entry signal before any trade is placed. |
What a Currency Strength Meter Actually Measures
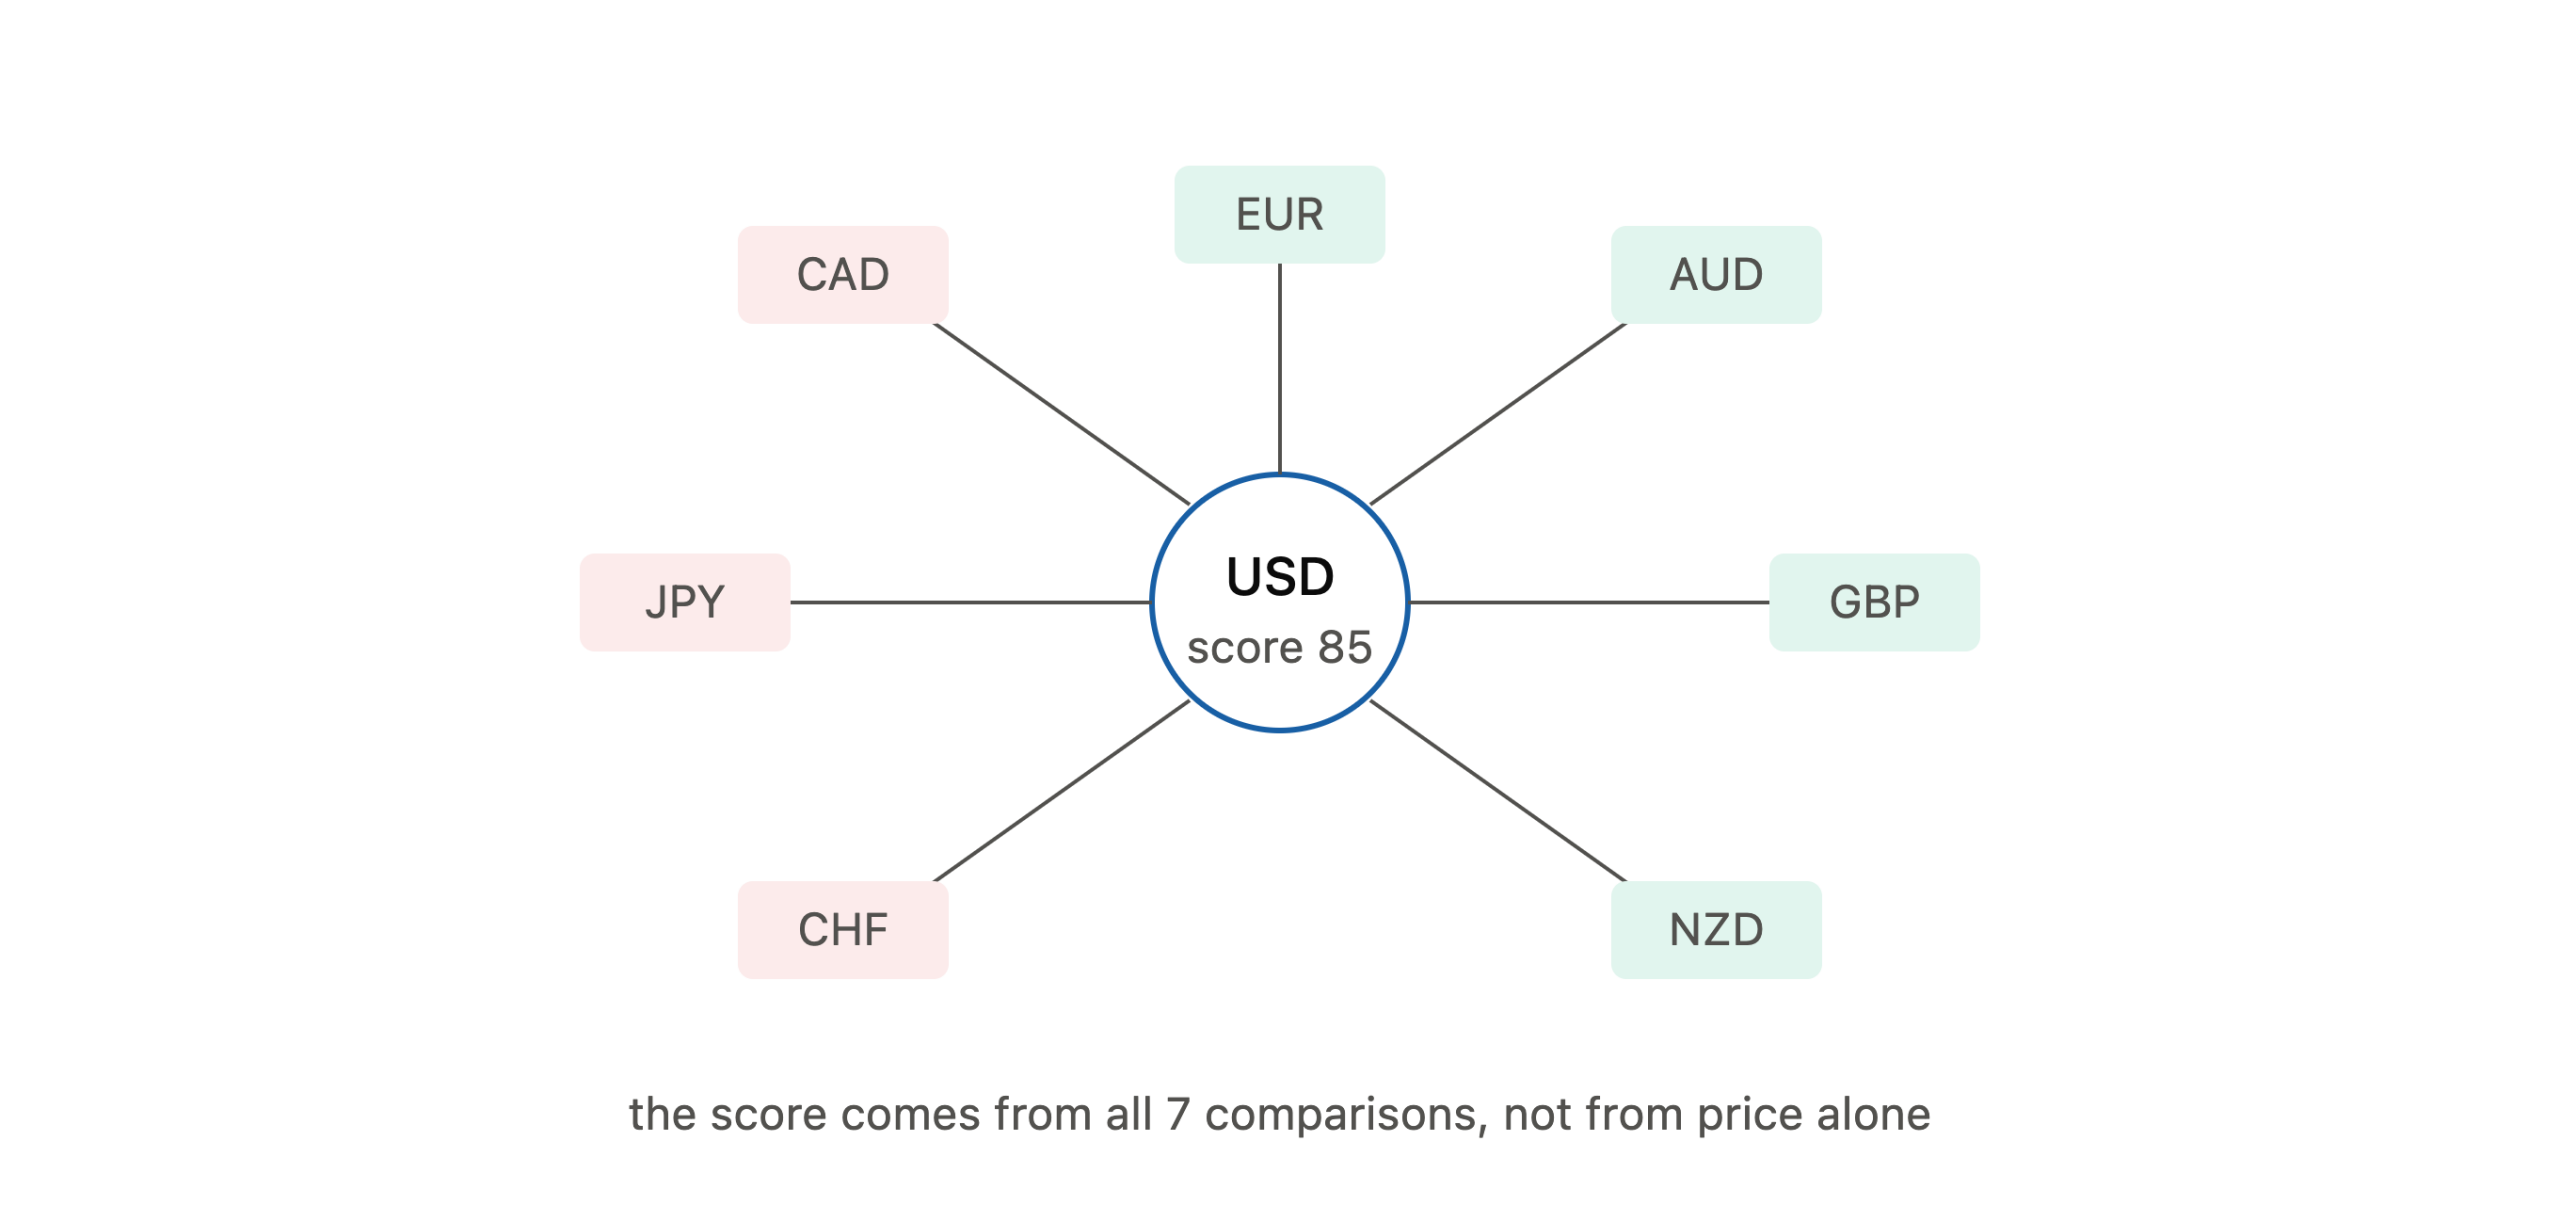
A currency strength meter is not telling you whether a currency is rising or falling on its own. It is showing you how that currency stacks up against all the others right now. That difference sounds small, but most traders miss it completely, and it changes everything about how the tool gets used.
The meter tracks 8 major currencies: the US Dollar (USD), Euro (EUR), British Pound (GBP), Japanese Yen (JPY), Australian Dollar (AUD), New Zealand Dollar (NZD), Canadian Dollar (CAD), and Swiss Franc (CHF). Each currency receives a numerical score based on how it performs across its 7 counterpart pairs. A high score means that currency is outperforming most of the other majors. A low score means the reverse.
If the USD scores 85 on a 0-to-100 scale, the dollar is outperforming most of the market. If the JPY scores 12 on the same scale, the yen is lagging across almost every pair it appears in. The gap between those two readings creates the signal that matters for trading decisions.
Think of the meter as a leaderboard for the currency market. Whatever sits near the top is a candidate to buy when it is the base currency, and whatever sits near the bottom is what you look to sell against one of those strong names.
How the Meter Calculates Relative Strength
Most currency strength meters calculate their readings using one of two approaches. Understanding the method helps traders use the tool correctly and avoid misreading the output.
Percentage Change Method
The meter measures how much each currency has moved in percentage terms against each of the other 7 major currencies over a set lookback period. It then averages those 7 percentage changes into a single score. A lookback of one trading day is standard for intraday analysis.
RSI-Based Method
Some meters apply a modified version of the Relative Strength Index (RSI) across each currency’s pairs and average the results. This smooths short-term noise and produces a reading more aligned with swing-level momentum.
Neither one is really better than the other. The percentage change version reacts faster, which suits day traders, while the RSI version smooths out the noise and fits people holding trades for days at a time. Either way you end up with the same thing, a ranked list of who is gaining and who is losing right now.
Currency Strength Meter
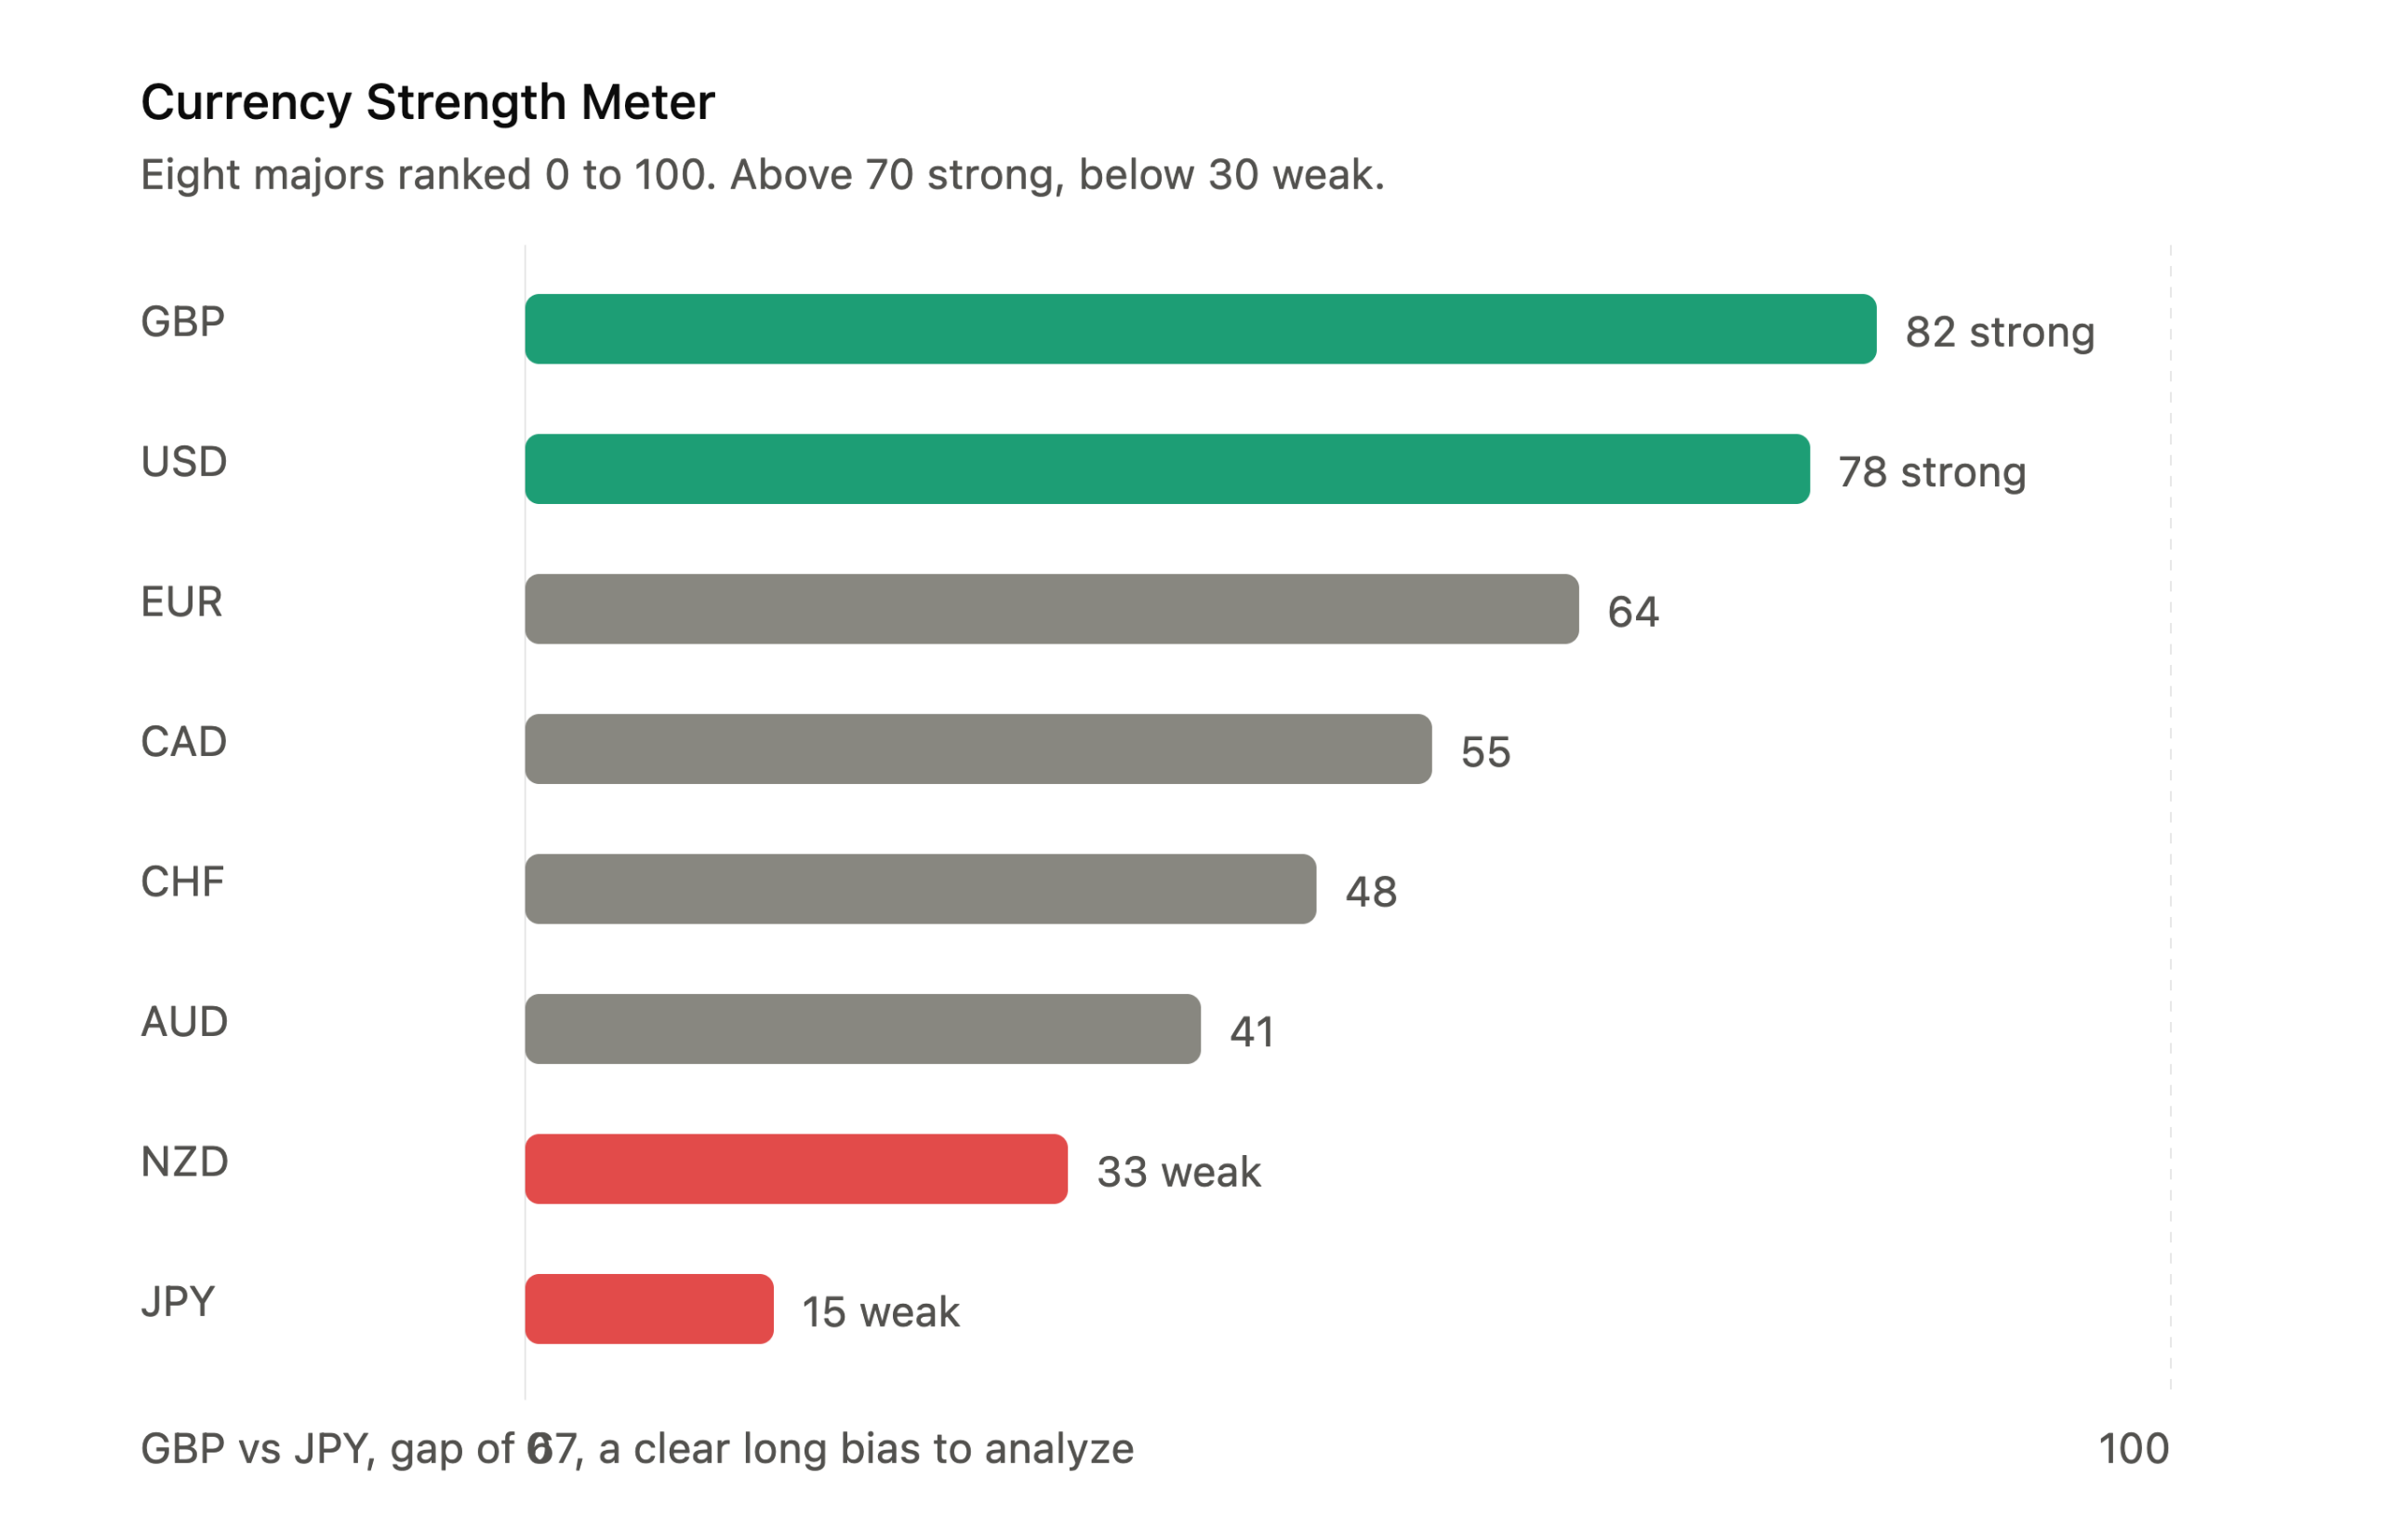
The meter above shows how the 8 majors rank from strongest to weakest. Use it alongside the strategy sections below. A high reading for one currency is not a trade signal on its own. It is a filter that identifies which pairs are worth opening on a chart.
How to Read the Meter Correctly
Reading the list is the easy part. Acting on it with any discipline is where people fall apart. The meter hands you a ranking from strongest to weakest, and the real skill is knowing which of those readings are actually worth doing something about.
These thresholds apply to a standard 0-to-100 scale:
- Above 70: The currency shows strong momentum across most of its pairs.
- Below 30: The currency shows broad weakness across most of its pairs.
- Gap of 40 or more points between two currencies: Pairing those two currencies creates a high-probability directional bias worth analyzing on the chart.
- Currencies clustered within 10 to 15 points of each other: These readings are neutral and rarely produce clean directional signals.
The reading changes throughout the trading day. A currency leading the meter at the London open may lose momentum by the New York overlap. Always check the reading just before opening a chart, not an hour before a potential entry.
Pairing the Strongest Currency Against the Weakest
Pairing is the whole idea behind the meter. You take the currency sitting at the top, put it against the one sitting at the bottom, and that combination is usually where the cleanest directional move shows up on the chart.
Here is a practical example. The GBP is ranked at 82 and the JPY is ranked at 15. The pair to analyze is GBP/JPY. The pound is strong across all its counterparts and the yen is weak across all its counterparts. On the GBP/JPY chart, that relative divergence typically appears as a clear uptrend with well-defined higher highs.
This pairing framework shows the logic in practice:
| Strongest Currency | Weakest Currency | Pair to Watch | Expected Direction |
|---|---|---|---|
| GBP (82) | JPY (15) | GBP/JPY | Long |
| USD (78) | AUD (20) | AUD/USD | Short |
| EUR (75) | NZD (18) | EUR/NZD | Long |
| CAD (71) | CHF (25) | CAD/CHF | Long |
The pair with the widest gap between the two strength readings typically produces the clearest price action. Use that pair as the primary analysis target. If the chart confirms the directional bias, the trade is worth evaluating. If the chart contradicts the meter reading, skip it and wait for the next opportunity.
A Step-by-Step Currency Strength Trading Strategy
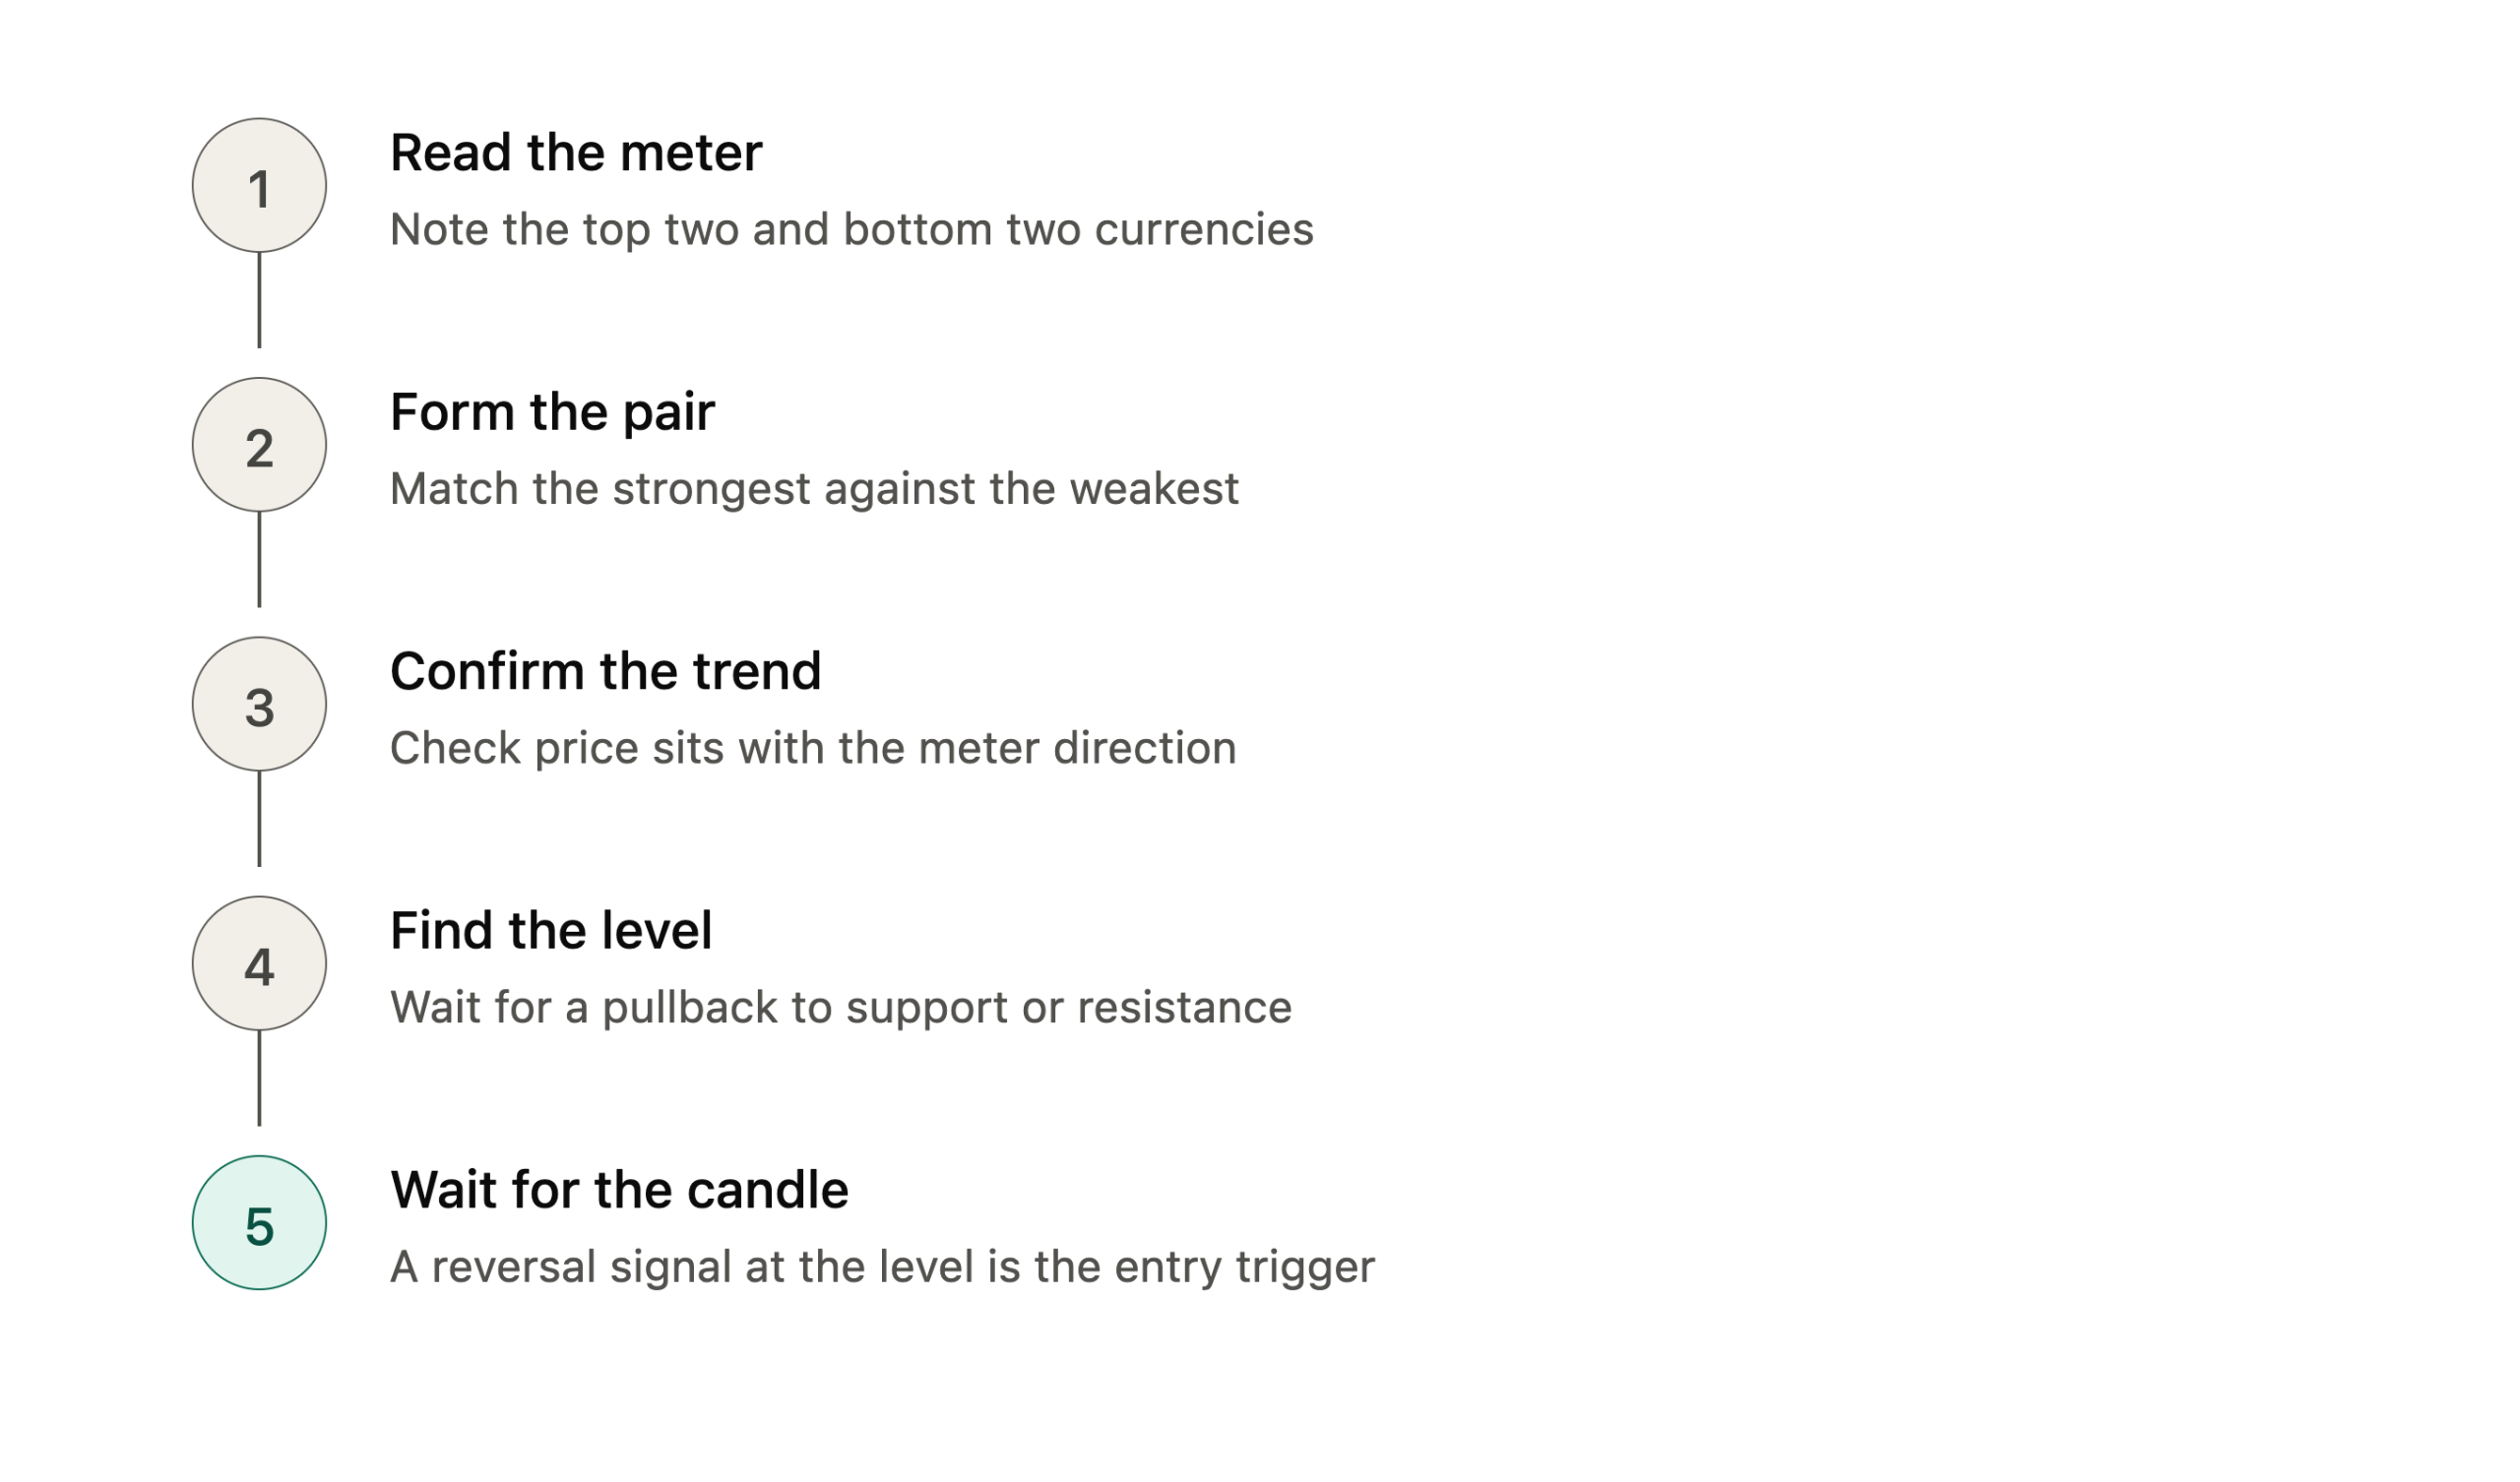
The meter is the starting point, not the complete system. Here is a five-step process that uses strength as a filter and price action as the entry trigger.
Follow these steps in order before placing any trade:
- Open the meter and note the top two and bottom two currencies. Look for clear separation in the readings, not marginal differences. A top currency above 70 and a bottom currency below 30 creates a workable setup.
- Form the pair by matching the strongest currency against the weakest. If the gap is less pronounced, check the second-strongest currency against the weakest as an alternative pair.
- Open the chart for that pair on your trading timeframe. Confirm the chart is trending in the direction the meter suggests. For a GBP/JPY long, price should sit above its key moving averages. It should also be making higher highs and higher lows.
- Locate the nearest support or resistance level on the chart. Wait for price to pull back toward support on a long setup, or rally into resistance on a short setup, before looking at entry.
- Wait for a candlestick confirmation signal at that level. A pin bar, bullish engulfing candle, or inside bar at a structural level aligned with the meter reading is the entry trigger. Set the stop loss below support for longs or above resistance for shorts. Define the risk before placing the order.
The Role of Confirmation
The meter gives you direction, the chart tells you where, and the candlestick tells you when. Nothing goes live until those three line up.
If the meter shows a strong GBP reading but the GBP/JPY chart shows price sitting at major resistance, wait. Look for a break above that level or identify the short-side opportunity on a different pair.On its own, strength just gives you a sloppy entry. It is when you stack it with structure and a price action signal that a rough directional lean turns into a real setup with a stop you can actually define.
How to Combine the Meter With Other Tools
The currency strength meter works best as a pre-chart filter. It identifies which pair to look at. The chart identifies where and when. These four tools combine directly with the meter to complete the picture:
- Trend direction via moving averages: Once the meter identifies a pair, apply the 20-period and 50-period exponential moving averages (EMAs) to the chart. Take long trades only when price sits above both EMAs. Take short trades only when price sits below both EMAs. This keeps every trade on the right side of the prevailing trend.
- Support and resistance levels: Mark horizontal levels on the chart before checking any strength reading. When price pulls back to a key support zone and the meter confirms the base currency is strong, the probability of a bounce increases meaningfully. The level provides a precise entry point and stop placement the meter cannot offer alone.
- Candlestick signals: A bullish engulfing candle at support, combined with a high strength reading for the base currency, is one of the cleanest setups in forex trading. The candlestick solves the timing problem the meter cannot address on its own.
- Volatility context: A strength reading during a low-volatility consolidation period can reflect stale momentum rather than fresh momentum. Pairing the meter with volatility indicators confirms whether a reading reflects active market energy or a quiet, directionless session.
Spotting structural levels with confidence is a prerequisite for trading with any filter, the strength meter included. Reading forex charts at an intermediate level gives traders that foundation. The meter tells you which chart to open. The chart tells you what to do from there.
The Best Timeframe for Currency Strength Analysis
This is one of the most overlooked mechanics in currency strength trading, and it produces more false signals than almost any other mistake. The strength reading on the meter corresponds to a specific lookback window. That window must match the chart timeframe being analyzed.
A meter set to measure strength over the past 24 hours reflects daily-level momentum. A meter set to a 4-hour window reflects short-term momentum that can shift within a single session. Using a long-lookback meter on a short chart creates signals that contradict the chart pattern. Using a short-lookback meter on a long chart misses the bigger trend entirely.
Use this alignment as a starting reference:
| Trading Style | Meter Lookback | Chart Timeframe |
|---|---|---|
| Swing Trader | Daily (24 Hours) | 4H or Daily |
| Day Trader | 4-Hour Window | 1H |
| Scalper | 1-Hour Window | 15M or 5M |
The practical rule is to set the meter’s lookback period at least one level above the chart timeframe. Swing traders on a 4H chart should reference daily strength. Day traders on a 1H chart should use a 4-hour reading. Getting this alignment right removes one of the most common sources of confusion in strength-based trading.
Common Currency Strength Meter Mistakes
Most traders who find the meter useful still repeat the same errors consistently. These five mistakes account for the majority of losing trades taken on strength-based setups.
Here are the five mistakes most likely to produce false signals:
Trading on meter strength alone
A high reading means the move has already happened. If you jump in without a real level on the chart to enter from, you are usually late, catching the tail end after the good part is gone. The meter points you in a direction, it does not time your entry.
Ignoring the meter’s timeframe setting
A 1-hour strength reading on a swing trade setup is noise, not signal. Match the meter’s lookback period to the chart timeframe every single time.
Chasing a move that is already extended
When the same top-and-bottom pairing has been sitting there for hours and price is already 3 to 4 ATR from the session low, you have missed it. Either wait for a pullback or keep an eye out for the next rotation in strength.
Acting on marginal differences in readings
A currency ranked 55 against a currency ranked 48 does not create a meaningful directional bias. A gap of at least 40 points on a standard 0-to-100 scale is the minimum threshold for a signal worth analyzing.
Acting on readings taken during news events
Major releases such as non-farm payrolls and central bank decisions spike currency readings artificially and temporarily. A reading taken within 30 minutes of a scheduled high-impact event does not reflect underlying trend momentum. Always check the economic calendar before acting on any strength reading.
Backtesting trading strategies that include the meter as a filter reveals which of these mistakes is most costly for each trader’s style. Traders who test strength-based setups on historical data find a consistent result. The “trading on strength alone” mistake produces the widest drawdowns. Entry timing becomes imprecise and stop placement becomes arbitrary without a structural level as the anchor.
Also Read: Smart Money Concepts Trading Strategy That Actually Works
Conclusion
A currency strength meter solves one of the most practical problems in forex trading: deciding which of the 28 major pairs to analyze. Rather than scanning every chart, the meter narrows the field to the pairs with the highest directional momentum by pairing the strongest currency against the weakest.
The meter earns its keep as a filter, not a trigger. All it does is point you to where the market’s energy is sitting right now. The rest, the price action, the structure, the candlestick, is what actually gets you a precise entry that a strength reading never could on its own.
Frequently Asked Questions
What is a currency strength meter in forex?
A currency strength meter ranks the 8 major currencies from strongest to weakest at any given moment. The 8 tracked currencies are the USD, EUR, GBP, JPY, AUD, NZD, CAD, and CHF. The meter measures how each currency is performing across all its counterpart pairs and averages those readings into a single score. Traders use the ranked output to identify which currency has the most momentum and which has the least, then pair them to create a directional bias for chart analysis.
How do you use a currency strength meter?
Open the meter and note the currency with the highest reading and the currency with the lowest reading. Pair those two currencies to get the target pair. Open that pair’s chart and confirm the trend direction using moving averages or price structure. Wait for a pullback to a key support or resistance level. Look for a candlestick signal at that level before entering. The meter gives direction, the chart gives location, and the candlestick gives timing.
How do you pair currencies using the strength meter?
Match the currency with the highest reading against the currency with the lowest reading. If the stronger currency is the base in the resulting pair, look for long opportunities. If the stronger currency is the quote currency, look for short opportunities. For example, if the USD is ranked first and the JPY is ranked last, USD/JPY is the pair to analyze for long setups, provided the chart confirms the directional bias.
Can you trade the currency strength meter as a standalone signal?
Not reliably. The meter identifies momentum direction but does not specify where to enter, where to place a stop, or whether price is at a favorable risk-to-reward location on the chart. Trading on meter strength alone typically means entering after the main move has already occurred. Combining the meter with support and resistance levels and a candlestick entry signal gives trades a defined risk level and a precise entry point.
What timeframe works best with a currency strength meter?
The meter’s lookback period should be set at least one level above the chart timeframe being traded. Swing traders on the 4H chart should reference a daily (24-hour) strength reading. Day traders on the 1H chart should use a 4-hour lookback. Scalpers on 15M or 5M charts should use a 1-hour reading. Mismatching the meter’s lookback to the chart timeframe is one of the most consistent causes of false signals in strength-based trading.