Learn To Trade Forex • Best Forex Trading Course • AsiaForexMentor

Rising Wedge Pattern Forex Breakout Guide 2026

Written by

Ezekiel Chew

Updated on

August 5, 2026

i
Its a default text

Rising Wedge Pattern Forex Breakout Guide 2026

Written by:

Last updated on:

August 5, 2026

The rising wedge pattern is built to look bullish. Price grinds out higher highs and higher lows the whole time it's forming, and that's exactly why so many traders buy into the rally. Then they get trapped on the wrong side the moment it finally breaks.

ABOUT THIS GUIDE

This guide covers how to identify a valid rising wedge pattern on any forex chart, which confluence factors separate a genuine setup from noise, and the exact entry, stop loss, and target rules for trading the breakout. 


QUICK ANSWER

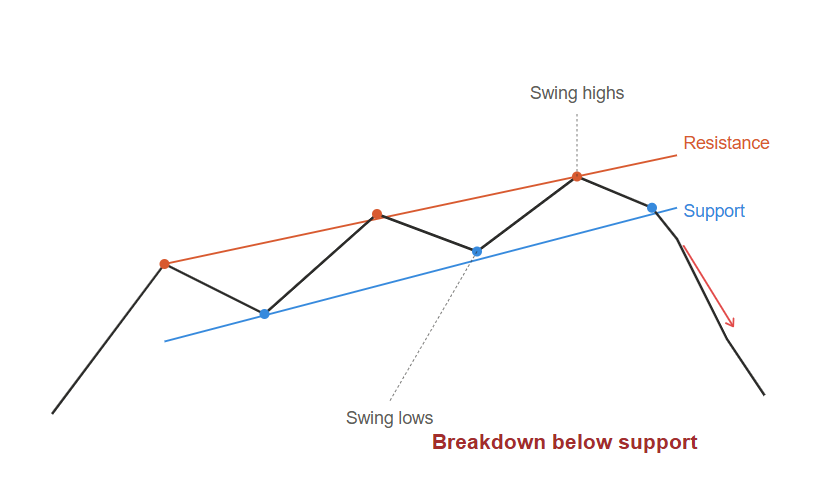
A rising wedge pattern is a bearish reversal formation. Price makes higher highs and higher lows inside two upward-sloping, converging trendlines, with the lower trendline rising faster than the upper. That compresses price toward a breakout. Once price closes below the lower trendline, the pattern is signaling a sustained move lower in forex markets.

What the Rising Wedge Pattern Looks Like on a Chart

 Anatomy of a rising wedge: swing highs pin the resistance line, swing lows pin the steeper support line, and price breaks down once the lines converge.

Why the Rising Wedge Is a Bearish Reversal Pattern

How to Identify a Valid Rising Wedge in Forex

Not every converging structure on a chart earns the label rising wedge pattern in forex. There are five criteria to run through before building a trade idea around one. Meet all five and it's worth watching. Miss even one and it isn't a valid setup yet.

Here are the five criteria for confirming a valid rising wedge pattern:

  1. Both trendlines slope upward. The upper one connects swing highs, the lower one connects swing lows, and both angle in the same direction.
  2. The lower trendline is steeper than the upper. This convergence is what creates the wedge shape in the first place. If the lines run parallel instead, that's a channel, not a wedge.
  3. At least two touch points on each trendline. Price needs to have tested each line at least twice. Three touches per line makes for a more reliable read.
  4. Decreasing swing amplitude. Each move within the wedge should cover less ground than the one before it. Expanding swings mean a different pattern type altogether.
  5. The wedge forms after a sustained uptrend. A rising wedge at the top of a significant rally is a reversal signal. That same shape during a retracement inside a downtrend can act as a continuation signal instead, so context matters more than the shape alone.
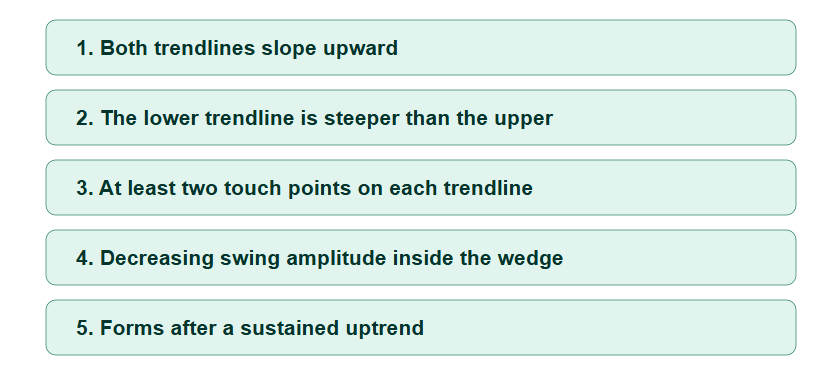
All five conditions must be met before treating a converging structure as a valid rising wedge.

The most common mistake at this stage is calling the pattern before both trendlines are confirmed. One converging line isn't a wedge, no matter how it looks. Patience here is what protects capital later in the trade.

For a wider view of how the rising wedge fits within the broader family of forex patterns worth tracking, that guide covers the full picture across timeframes.

Confluence Factors That Confirm the Setup

A rising wedge pattern on its own is a reasonable warning. Confluence is what turns it into a high-probability trade. Below are the factors that separate a genuine setup from chart noise.

The strongest confluence factors for a rising wedge setup are:

  • Resistance level alignment. When the upper trendline lines up with a prior resistance zone or a key round number, price runs into rejection at two levels at once. That double resistance meaningfully raises the odds of a real reversal.
  • Bearish candlestick confirmation.shooting star or bearish engulfing candle forming near the upper trendline is real-time evidence of rejection, layered right on top of the structural pattern.
  • Bearish divergence on RSI or MACD . Price makes higher highs inside the wedge, but the momentum indicator makes lower highs. That divergence confirms the fading buying pressure the pattern is already hinting at structurally.
  • Higher timeframe resistance. A rising wedge on the one-hour chart that forms inside a resistance zone on the four-hour or daily chart is stacking two signals, not one. The higher timeframe validates the lower one.
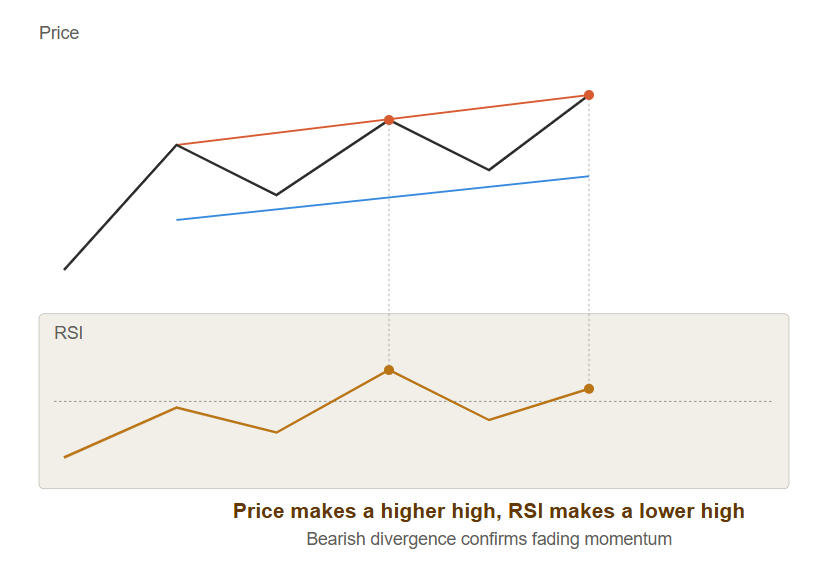
Price prints a higher high inside the wedge while RSI prints a lower high at the same point in time — the clearest single confluence signal.

The more of these factors line up, the stronger the setup. One factor is just a starting point. Two or three together change the risk-to-reward math significantly, and Asia Forex Mentor's rule of thumb is at least two confluence factors before touching any rising wedge trade.

How to Trade a Rising Wedge Pattern Step by Step

Trading the rising wedge breakout follows a specific sequence, and rushing any part of it cuts into the edge the pattern offers. Here's the full process, entry trigger through target exit.

The Entry Trigger

The entry comes on a confirmed close below the lower trendline of the wedge. A wick that pierces the line and then recovers doesn't count. The candle actually has to close below the trendline on whatever timeframe is being traded.

On the four-hour and daily chart, waiting for that full candle close instead of jumping on the first pierce filters out a lot of false signals. That costs the first 10 to 20 pips. It also keeps you out of setups that reverse right back after the initial break, which tend to be the more expensive mistake.

Some setups give a second chance. After the initial break, price often retests the broken trendline from underneath before continuing lower. That retest offers a tighter stop and a cleaner entry for anyone who missed the first breakout candle.

Rising Wedge Stop Loss Placement

The stop loss sits above the most recent swing high formed inside the wedge before the breakout. If price climbs back above that level after the break, the pattern has failed and the trade is done.

The stop shouldn't sit right at the upper trendline. By the time price gets there after breaking the lower one, the structure has already broken down anyway, so the last swing high inside the wedge is the real invalidation point.

On a four-hour chart setup, stop distance typically runs 20 to 50 pips. Wider wedges need wider stops. Position size gets calculated around the correct stop distance, not around whatever distance feels comfortable.

Rising Wedge Target Calculation

The measured move target comes from measuring the height of the wedge at its widest point, then projecting that same distance down from the breakout candle. It's a method that holds up consistently across major forex pairs and timeframes.

A secondary target sits at the nearest structural support level below the breakout point. On a clean setup, that level often gets hit before the full measured move plays out. Taking partial profits there, then letting the rest run to the measured move target, is the standard way to manage it.

Risk-to-reward on a well-structured rising wedge trade typically lands somewhere between 2:1 and 4:1. Those are the setups worth the wait. Anything below that isn't worth the exposure, especially on a bearish reversal trade where retests happen often.
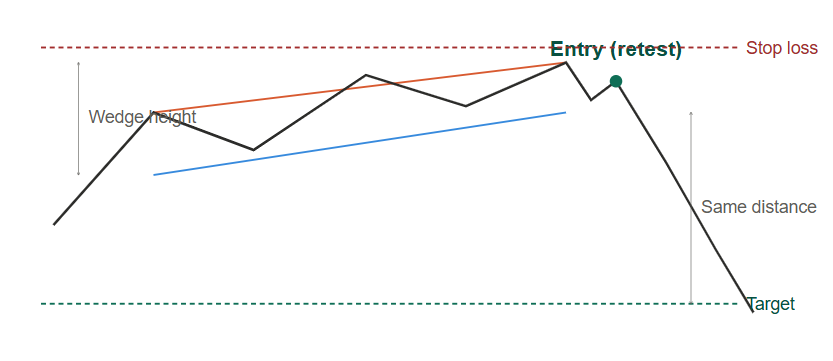
 Entry, stop, and target all in one place — the target distance mirrors the wedge's own height, projected down from the breakout.

Rising Wedge vs Falling Wedge

The rising wedge and the falling wedge run on the same structural logic. Two converging trendlines. Decreasing volume. Compressed price action. What differs is the directional bias.

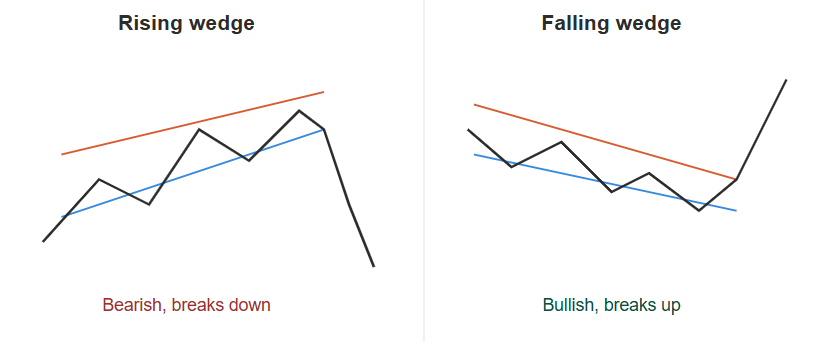
The table below compares the key features of both patterns:

Feature Rising Wedge Falling Wedge
Trendline direction Both slope upward Both slope downward
Expected breakout direction Downward (bearish) Upward (bullish)
Where it typically forms Top of an uptrend Bottom of a downtrend
Reversal or continuation Either is possible Either is possible
Volume as pattern develops Decreasing Decreasing

 Same converging structure, opposite slope, opposite bias.

Rising wedge, bearish intent. Falling wedge, bullish potential. The mechanics behind both are identical; only the direction of the expected trade flips.

Context within the broader trend decides whether either pattern is acting as a reversal or a continuation. A rising wedge at the top of a major uptrend is a reversal setup. One that forms during a brief pullback inside a downtrend is a continuation signal instead. Zooming out to the higher timeframe usually settles the question fast.

A practical rule worth remembering: when the wedge climbs toward an obvious resistance area, treat it as a bearish reversal. When a wedge falls toward an obvious support area, treat the falling wedge version as a bullish reversal.

Common Mistakes Traders Make With This Pattern

Most losses tied to the rising wedge pattern trace back to a small set of repeatable errors. Knowing them ahead of time prevents the costliest ones.

Here are the five mistakes that cost traders the most on rising wedge setups:

  • Entering short before the breakout. The wedge signals potential, not confirmation. Entering while price is still inside it is trading anticipation, not evidence. Wait for the candle close below the lower trendline.
  • Ignoring the higher timeframe trend. A rising wedge on the fifteen-minute chart inside a strong daily uptrend is noise, not a trade. Top-down analysis is what decides whether the dominant trend confirms or kills the setup.
  • Using a stop that's too tight. Placing the stop just below the breakout candle instead of above the last swing high means getting stopped out by ordinary volatility. Accept the correct stop distance and size the position down instead.
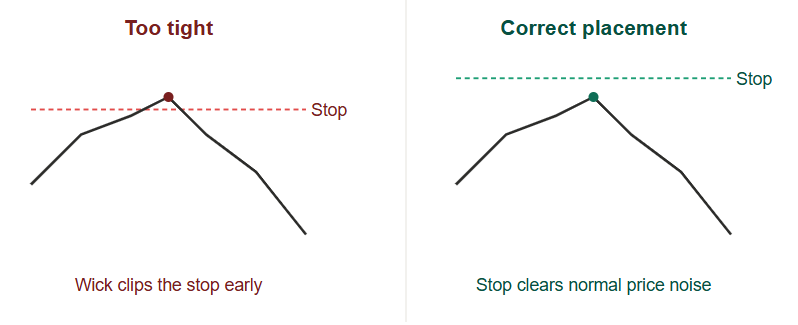
 The distance between these two placements is often the difference between a stopped-out trade and a winning one.

  • Taking the trade without confluence. A wedge with no supporting factors is a guess dressed up as a setup. Require at least one confluence factor before entering: divergence, resistance alignment, or a bearish candlestick signal.
  • Expecting a straight-line drop. Retests of the broken trendline happen often after the initial break. Plan for it before it happens. A retest doesn't invalidate the trade unless price closes back above the last swing high inside the wedge.

Retail traders react to shapes. Traders who understand what's driving those shapes trade the logic underneath them instead. The pattern tells you what might happen. Confluence, and a confirmed break, tell you when to actually pull the trigger.

Also Read: Symmetrical Triangle: How to Trade the Breakout

Conclusion

The rising wedge pattern is one of the more reliable bearish reversal signals in forex, when the conditions line up. The pattern itself is the starting point, not the trade.

The real edge comes from waiting for a confirmed candle close below the lower trendline, validating the setup with at least one confluence factor, placing the stop above the last swing high inside the wedge, and calculating the measured move target from the widest point of the formation.

Retail traders rush the entry, skip the confluence check, and use stops that get taken out on the first spike in volatility. Traders who read market structure instead of just the shape tend to avoid these mistakes consistently.

Frequently Asked Questions

Is a rising wedge pattern bullish or bearish?

A rising wedge pattern is bearish, despite the upward-sloping shape. The narrowing structure signals fading buying pressure, and the pattern typically resolves with price breaking down through the lower trendline.

How do you trade a rising wedge pattern breakout?

Wait for a full candle to close below the lower trendline, then look for a retest of that broken line from underneath before entering short. Entering the moment price touches the lower line, without waiting for confirmation, leads to far more losing trades.

Where should the stop loss go on a rising wedge pattern?

The stop loss belongs above the most recent swing high inside the wedge, not directly on the trendline itself. On more volatile pairs, adding extra room based on the pair's average true range helps avoid getting stopped out by normal price noise.

How do you calculate the target for a rising wedge pattern?

Measure the height of the widest part of the wedge and project that same distance down from the breakout point. This can be compared against the nearest real support level on the chart, and whichever target sits closer is usually treated as the first target.

What is the difference between a rising wedge and a falling wedge?

A rising wedge slopes upward and is bearish, usually breaking down. A falling wedge slopes downward and is bullish, usually breaking up. Both patterns are traded using the same confluence and entry rules, just in opposite directions.


About Ezekiel Chew​

Ezekiel Chew, founder and head of training at Asia Forex Mentor, is a renowned forex expert, frequently invited to speak at major industry events. Known for his deep market insights, Ezekiel is one of the top traders committed to supporting the trading community. Making six figures per trade, he also trains traders working in banks, fund management, and prop trading firms.

Currency Strength Meter Trading Strategy 2026

A lot of traders install a currency strength meter and still never trade it well. The problem is they treat what is really just a directional filter like a full entry signal, and it shows up in their results. ABOUT THIS GUIDE This guide covers what a currency strength meter

Read More

Fibonacci Retracement Forex Trading Guide 2026

Most traders who use fibonacci retracement anchor the tool to the wrong swing points, then treat every level the chart produces as a valid trade signal. ABOUT THIS GUIDE This guide covers how to draw fibonacci retracement correctly on a real forex chart, which levels carry genuine weight, and the

Read More

Multiple Timeframe Analysis How Institutions Trade Forex

Most forex traders who get stopped out consistently are missing the same thing: multiple timeframe analysis. They always blindly enter trades based from the the larger market structure is doing. ABOUT THIS GUIDE This guide explains the complete multiple timeframe analysis process used by institutional forex traders. It covers why

Read More

Double Top Pattern Forex Trading Guide In 2026

The double top pattern has taken more money from traders than it has returned to them. The pattern works fine. The problem is that most traders pull the trigger before the neckline ever breaks. ABOUT THIS GUIDE This guide explains what the double top pattern is, how to identify it

Read More

Market Structure Trading Strategy That Actually Works

Market structure trading stops working the moment traders ignore location and timing. Clean analysis on the wrong side of a level produces the same outcome every time. The move starts without you, and the chart tells you exactly why, after the fact. ABOUT THIS GUIDE This guide covers three approaches

Read More

AFM Trading Summit Live

Date: Coming Soon

Join us at the AFM Trading Summit Live and learn from top industry experts through live trading sessions, market insights, and actionable strategies.

Rising Wedge Pattern Forex Breakout Guide 2026

4.0
Overall Trust Index

Written by:

Updated:

August 5, 2026
The rising wedge pattern is built to look bullish. Price grinds out higher highs and higher lows the whole time it's forming, and that's exactly why so many traders buy into the rally. Then they get trapped on the wrong side the moment it finally breaks.

ABOUT THIS GUIDE

This guide covers how to identify a valid rising wedge pattern on any forex chart, which confluence factors separate a genuine setup from noise, and the exact entry, stop loss, and target rules for trading the breakout. 
 

QUICK ANSWER

A rising wedge pattern is a bearish reversal formation. Price makes higher highs and higher lows inside two upward-sloping, converging trendlines, with the lower trendline rising faster than the upper. That compresses price toward a breakout. Once price closes below the lower trendline, the pattern is signaling a sustained move lower in forex markets.

What the Rising Wedge Pattern Looks Like on a Chart

 Anatomy of a rising wedge: swing highs pin the resistance line, swing lows pin the steeper support line, and price breaks down once the lines converge.

Why the Rising Wedge Is a Bearish Reversal Pattern

How to Identify a Valid Rising Wedge in Forex

Not every converging structure on a chart earns the label rising wedge pattern in forex. There are five criteria to run through before building a trade idea around one. Meet all five and it's worth watching. Miss even one and it isn't a valid setup yet.

Here are the five criteria for confirming a valid rising wedge pattern:

  1. Both trendlines slope upward. The upper one connects swing highs, the lower one connects swing lows, and both angle in the same direction.
  2. The lower trendline is steeper than the upper. This convergence is what creates the wedge shape in the first place. If the lines run parallel instead, that's a channel, not a wedge.
  3. At least two touch points on each trendline. Price needs to have tested each line at least twice. Three touches per line makes for a more reliable read.
  4. Decreasing swing amplitude. Each move within the wedge should cover less ground than the one before it. Expanding swings mean a different pattern type altogether.
  5. The wedge forms after a sustained uptrend. A rising wedge at the top of a significant rally is a reversal signal. That same shape during a retracement inside a downtrend can act as a continuation signal instead, so context matters more than the shape alone.

All five conditions must be met before treating a converging structure as a valid rising wedge.

The most common mistake at this stage is calling the pattern before both trendlines are confirmed. One converging line isn't a wedge, no matter how it looks. Patience here is what protects capital later in the trade.

For a wider view of how the rising wedge fits within the broader family of forex patterns worth tracking, that guide covers the full picture across timeframes.

Confluence Factors That Confirm the Setup

A rising wedge pattern on its own is a reasonable warning. Confluence is what turns it into a high-probability trade. Below are the factors that separate a genuine setup from chart noise.

The strongest confluence factors for a rising wedge setup are:

  • Resistance level alignment. When the upper trendline lines up with a prior resistance zone or a key round number, price runs into rejection at two levels at once. That double resistance meaningfully raises the odds of a real reversal.
  • Bearish candlestick confirmation.shooting star or bearish engulfing candle forming near the upper trendline is real-time evidence of rejection, layered right on top of the structural pattern.
  • Bearish divergence on RSI or MACD. Price makes higher highs inside the wedge, but the momentum indicator makes lower highs. That divergence confirms the fading buying pressure the pattern is already hinting at structurally.
  • Higher timeframe resistance. A rising wedge on the one-hour chart that forms inside a resistance zone on the four-hour or daily chart is stacking two signals, not one. The higher timeframe validates the lower one.

Price prints a higher high inside the wedge while RSI prints a lower high at the same point in time — the clearest single confluence signal.

The more of these factors line up, the stronger the setup. One factor is just a starting point. Two or three together change the risk-to-reward math significantly, and Asia Forex Mentor's rule of thumb is at least two confluence factors before touching any rising wedge trade.

How to Trade a Rising Wedge Pattern Step by Step

Trading the rising wedge breakout follows a specific sequence, and rushing any part of it cuts into the edge the pattern offers. Here's the full process, entry trigger through target exit.

The Entry Trigger

The entry comes on a confirmed close below the lower trendline of the wedge. A wick that pierces the line and then recovers doesn't count. The candle actually has to close below the trendline on whatever timeframe is being traded.

On the four-hour and daily chart, waiting for that full candle close instead of jumping on the first pierce filters out a lot of false signals. That costs the first 10 to 20 pips. It also keeps you out of setups that reverse right back after the initial break, which tend to be the more expensive mistake.

Some setups give a second chance. After the initial break, price often retests the broken trendline from underneath before continuing lower. That retest offers a tighter stop and a cleaner entry for anyone who missed the first breakout candle.

Rising Wedge Stop Loss Placement

The stop loss sits above the most recent swing high formed inside the wedge before the breakout. If price climbs back above that level after the break, the pattern has failed and the trade is done.

The stop shouldn't sit right at the upper trendline. By the time price gets there after breaking the lower one, the structure has already broken down anyway, so the last swing high inside the wedge is the real invalidation point.

On a four-hour chart setup, stop distance typically runs 20 to 50 pips. Wider wedges need wider stops. Position size gets calculated around the correct stop distance, not around whatever distance feels comfortable.

Rising Wedge Target Calculation

The measured move target comes from measuring the height of the wedge at its widest point, then projecting that same distance down from the breakout candle. It's a method that holds up consistently across major forex pairs and timeframes.

A secondary target sits at the nearest structural support level below the breakout point. On a clean setup, that level often gets hit before the full measured move plays out. Taking partial profits there, then letting the rest run to the measured move target, is the standard way to manage it.

Risk-to-reward on a well-structured rising wedge trade typically lands somewhere between 2:1 and 4:1. Those are the setups worth the wait. Anything below that isn't worth the exposure, especially on a bearish reversal trade where retests happen often.

 Entry, stop, and target all in one place — the target distance mirrors the wedge's own height, projected down from the breakout.

Rising Wedge vs Falling Wedge

The rising wedge and the falling wedge run on the same structural logic. Two converging trendlines. Decreasing volume. Compressed price action. What differs is the directional bias. The table below compares the key features of both patterns:
Feature Rising Wedge Falling Wedge
Trendline direction Both slope upward Both slope downward
Expected breakout direction Downward (bearish) Upward (bullish)
Where it typically forms Top of an uptrend Bottom of a downtrend
Reversal or continuation Either is possible Either is possible
Volume as pattern develops Decreasing Decreasing

 Same converging structure, opposite slope, opposite bias.

Rising wedge, bearish intent. Falling wedge, bullish potential. The mechanics behind both are identical; only the direction of the expected trade flips.

Context within the broader trend decides whether either pattern is acting as a reversal or a continuation. A rising wedge at the top of a major uptrend is a reversal setup. One that forms during a brief pullback inside a downtrend is a continuation signal instead. Zooming out to the higher timeframe usually settles the question fast.

A practical rule worth remembering: when the wedge climbs toward an obvious resistance area, treat it as a bearish reversal. When a wedge falls toward an obvious support area, treat the falling wedge version as a bullish reversal.

Common Mistakes Traders Make With This Pattern

Most losses tied to the rising wedge pattern trace back to a small set of repeatable errors. Knowing them ahead of time prevents the costliest ones.

Here are the five mistakes that cost traders the most on rising wedge setups:

  • Entering short before the breakout. The wedge signals potential, not confirmation. Entering while price is still inside it is trading anticipation, not evidence. Wait for the candle close below the lower trendline.
  • Ignoring the higher timeframe trend. A rising wedge on the fifteen-minute chart inside a strong daily uptrend is noise, not a trade. Top-down analysis is what decides whether the dominant trend confirms or kills the setup.
  • Using a stop that's too tight. Placing the stop just below the breakout candle instead of above the last swing high means getting stopped out by ordinary volatility. Accept the correct stop distance and size the position down instead.

 The distance between these two placements is often the difference between a stopped-out trade and a winning one.

  • Taking the trade without confluence. A wedge with no supporting factors is a guess dressed up as a setup. Require at least one confluence factor before entering: divergence, resistance alignment, or a bearish candlestick signal.
  • Expecting a straight-line drop. Retests of the broken trendline happen often after the initial break. Plan for it before it happens. A retest doesn't invalidate the trade unless price closes back above the last swing high inside the wedge.

Retail traders react to shapes. Traders who understand what's driving those shapes trade the logic underneath them instead. The pattern tells you what might happen. Confluence, and a confirmed break, tell you when to actually pull the trigger.

Also Read: Symmetrical Triangle: How to Trade the Breakout

Conclusion

The rising wedge pattern is one of the more reliable bearish reversal signals in forex, when the conditions line up. The pattern itself is the starting point, not the trade.

The real edge comes from waiting for a confirmed candle close below the lower trendline, validating the setup with at least one confluence factor, placing the stop above the last swing high inside the wedge, and calculating the measured move target from the widest point of the formation.

Retail traders rush the entry, skip the confluence check, and use stops that get taken out on the first spike in volatility. Traders who read market structure instead of just the shape tend to avoid these mistakes consistently.

Frequently Asked Questions

Is a rising wedge pattern bullish or bearish?

A rising wedge pattern is bearish, despite the upward-sloping shape. The narrowing structure signals fading buying pressure, and the pattern typically resolves with price breaking down through the lower trendline.

How do you trade a rising wedge pattern breakout?

Wait for a full candle to close below the lower trendline, then look for a retest of that broken line from underneath before entering short. Entering the moment price touches the lower line, without waiting for confirmation, leads to far more losing trades.

Where should the stop loss go on a rising wedge pattern?

The stop loss belongs above the most recent swing high inside the wedge, not directly on the trendline itself. On more volatile pairs, adding extra room based on the pair's average true range helps avoid getting stopped out by normal price noise.

How do you calculate the target for a rising wedge pattern?

Measure the height of the widest part of the wedge and project that same distance down from the breakout point. This can be compared against the nearest real support level on the chart, and whichever target sits closer is usually treated as the first target.

What is the difference between a rising wedge and a falling wedge?

A rising wedge slopes upward and is bearish, usually breaking down. A falling wedge slopes downward and is bullish, usually breaking up. Both patterns are traded using the same confluence and entry rules, just in opposite directions.

ezekiel chew asiaforexmentor

About Ezekiel Chew

Ezekiel Chew, founder and head of training at Asia Forex Mentor, is a renowned forex expert, frequently invited to speak at major industry events. Known for his deep market insights, Ezekiel is one of the top traders committed to supporting the trading community. Making six figures per trade, he also trains traders working in banks, fund management, and prop trading firms.

RELATED ARTICLES

Rising Wedge Pattern Forex Breakout Guide 2026

4.0
Overall Trust Index

Written by:

Updated:

August 5, 2026
The rising wedge pattern is built to look bullish. Price grinds out higher highs and higher lows the whole time it's forming, and that's exactly why so many traders buy into the rally. Then they get trapped on the wrong side the moment it finally breaks.

ABOUT THIS GUIDE

This guide covers how to identify a valid rising wedge pattern on any forex chart, which confluence factors separate a genuine setup from noise, and the exact entry, stop loss, and target rules for trading the breakout. 
 

QUICK ANSWER

A rising wedge pattern is a bearish reversal formation. Price makes higher highs and higher lows inside two upward-sloping, converging trendlines, with the lower trendline rising faster than the upper. That compresses price toward a breakout. Once price closes below the lower trendline, the pattern is signaling a sustained move lower in forex markets.

What the Rising Wedge Pattern Looks Like on a Chart

 Anatomy of a rising wedge: swing highs pin the resistance line, swing lows pin the steeper support line, and price breaks down once the lines converge.

Why the Rising Wedge Is a Bearish Reversal Pattern

How to Identify a Valid Rising Wedge in Forex

Not every converging structure on a chart earns the label rising wedge pattern in forex. There are five criteria to run through before building a trade idea around one. Meet all five and it's worth watching. Miss even one and it isn't a valid setup yet.

Here are the five criteria for confirming a valid rising wedge pattern:

  1. Both trendlines slope upward. The upper one connects swing highs, the lower one connects swing lows, and both angle in the same direction.
  2. The lower trendline is steeper than the upper. This convergence is what creates the wedge shape in the first place. If the lines run parallel instead, that's a channel, not a wedge.
  3. At least two touch points on each trendline. Price needs to have tested each line at least twice. Three touches per line makes for a more reliable read.
  4. Decreasing swing amplitude. Each move within the wedge should cover less ground than the one before it. Expanding swings mean a different pattern type altogether.
  5. The wedge forms after a sustained uptrend. A rising wedge at the top of a significant rally is a reversal signal. That same shape during a retracement inside a downtrend can act as a continuation signal instead, so context matters more than the shape alone.

All five conditions must be met before treating a converging structure as a valid rising wedge.

The most common mistake at this stage is calling the pattern before both trendlines are confirmed. One converging line isn't a wedge, no matter how it looks. Patience here is what protects capital later in the trade.

For a wider view of how the rising wedge fits within the broader family of forex patterns worth tracking, that guide covers the full picture across timeframes.

Confluence Factors That Confirm the Setup

A rising wedge pattern on its own is a reasonable warning. Confluence is what turns it into a high-probability trade. Below are the factors that separate a genuine setup from chart noise.

The strongest confluence factors for a rising wedge setup are:

  • Resistance level alignment. When the upper trendline lines up with a prior resistance zone or a key round number, price runs into rejection at two levels at once. That double resistance meaningfully raises the odds of a real reversal.
  • Bearish candlestick confirmation.shooting star or bearish engulfing candle forming near the upper trendline is real-time evidence of rejection, layered right on top of the structural pattern.
  • Bearish divergence on RSI or MACD. Price makes higher highs inside the wedge, but the momentum indicator makes lower highs. That divergence confirms the fading buying pressure the pattern is already hinting at structurally.
  • Higher timeframe resistance. A rising wedge on the one-hour chart that forms inside a resistance zone on the four-hour or daily chart is stacking two signals, not one. The higher timeframe validates the lower one.

Price prints a higher high inside the wedge while RSI prints a lower high at the same point in time — the clearest single confluence signal.

The more of these factors line up, the stronger the setup. One factor is just a starting point. Two or three together change the risk-to-reward math significantly, and Asia Forex Mentor's rule of thumb is at least two confluence factors before touching any rising wedge trade.

How to Trade a Rising Wedge Pattern Step by Step

Trading the rising wedge breakout follows a specific sequence, and rushing any part of it cuts into the edge the pattern offers. Here's the full process, entry trigger through target exit.

The Entry Trigger

The entry comes on a confirmed close below the lower trendline of the wedge. A wick that pierces the line and then recovers doesn't count. The candle actually has to close below the trendline on whatever timeframe is being traded.

On the four-hour and daily chart, waiting for that full candle close instead of jumping on the first pierce filters out a lot of false signals. That costs the first 10 to 20 pips. It also keeps you out of setups that reverse right back after the initial break, which tend to be the more expensive mistake.

Some setups give a second chance. After the initial break, price often retests the broken trendline from underneath before continuing lower. That retest offers a tighter stop and a cleaner entry for anyone who missed the first breakout candle.

Rising Wedge Stop Loss Placement

The stop loss sits above the most recent swing high formed inside the wedge before the breakout. If price climbs back above that level after the break, the pattern has failed and the trade is done.

The stop shouldn't sit right at the upper trendline. By the time price gets there after breaking the lower one, the structure has already broken down anyway, so the last swing high inside the wedge is the real invalidation point.

On a four-hour chart setup, stop distance typically runs 20 to 50 pips. Wider wedges need wider stops. Position size gets calculated around the correct stop distance, not around whatever distance feels comfortable.

Rising Wedge Target Calculation

The measured move target comes from measuring the height of the wedge at its widest point, then projecting that same distance down from the breakout candle. It's a method that holds up consistently across major forex pairs and timeframes.

A secondary target sits at the nearest structural support level below the breakout point. On a clean setup, that level often gets hit before the full measured move plays out. Taking partial profits there, then letting the rest run to the measured move target, is the standard way to manage it.

Risk-to-reward on a well-structured rising wedge trade typically lands somewhere between 2:1 and 4:1. Those are the setups worth the wait. Anything below that isn't worth the exposure, especially on a bearish reversal trade where retests happen often.

 Entry, stop, and target all in one place — the target distance mirrors the wedge's own height, projected down from the breakout.

Rising Wedge vs Falling Wedge

The rising wedge and the falling wedge run on the same structural logic. Two converging trendlines. Decreasing volume. Compressed price action. What differs is the directional bias. The table below compares the key features of both patterns:
Feature Rising Wedge Falling Wedge
Trendline direction Both slope upward Both slope downward
Expected breakout direction Downward (bearish) Upward (bullish)
Where it typically forms Top of an uptrend Bottom of a downtrend
Reversal or continuation Either is possible Either is possible
Volume as pattern develops Decreasing Decreasing

 Same converging structure, opposite slope, opposite bias.

Rising wedge, bearish intent. Falling wedge, bullish potential. The mechanics behind both are identical; only the direction of the expected trade flips.

Context within the broader trend decides whether either pattern is acting as a reversal or a continuation. A rising wedge at the top of a major uptrend is a reversal setup. One that forms during a brief pullback inside a downtrend is a continuation signal instead. Zooming out to the higher timeframe usually settles the question fast.

A practical rule worth remembering: when the wedge climbs toward an obvious resistance area, treat it as a bearish reversal. When a wedge falls toward an obvious support area, treat the falling wedge version as a bullish reversal.

Common Mistakes Traders Make With This Pattern

Most losses tied to the rising wedge pattern trace back to a small set of repeatable errors. Knowing them ahead of time prevents the costliest ones.

Here are the five mistakes that cost traders the most on rising wedge setups:

  • Entering short before the breakout. The wedge signals potential, not confirmation. Entering while price is still inside it is trading anticipation, not evidence. Wait for the candle close below the lower trendline.
  • Ignoring the higher timeframe trend. A rising wedge on the fifteen-minute chart inside a strong daily uptrend is noise, not a trade. Top-down analysis is what decides whether the dominant trend confirms or kills the setup.
  • Using a stop that's too tight. Placing the stop just below the breakout candle instead of above the last swing high means getting stopped out by ordinary volatility. Accept the correct stop distance and size the position down instead.

 The distance between these two placements is often the difference between a stopped-out trade and a winning one.

  • Taking the trade without confluence. A wedge with no supporting factors is a guess dressed up as a setup. Require at least one confluence factor before entering: divergence, resistance alignment, or a bearish candlestick signal.
  • Expecting a straight-line drop. Retests of the broken trendline happen often after the initial break. Plan for it before it happens. A retest doesn't invalidate the trade unless price closes back above the last swing high inside the wedge.

Retail traders react to shapes. Traders who understand what's driving those shapes trade the logic underneath them instead. The pattern tells you what might happen. Confluence, and a confirmed break, tell you when to actually pull the trigger.

Also Read: Symmetrical Triangle: How to Trade the Breakout

Conclusion

The rising wedge pattern is one of the more reliable bearish reversal signals in forex, when the conditions line up. The pattern itself is the starting point, not the trade.

The real edge comes from waiting for a confirmed candle close below the lower trendline, validating the setup with at least one confluence factor, placing the stop above the last swing high inside the wedge, and calculating the measured move target from the widest point of the formation.

Retail traders rush the entry, skip the confluence check, and use stops that get taken out on the first spike in volatility. Traders who read market structure instead of just the shape tend to avoid these mistakes consistently.

Frequently Asked Questions

Is a rising wedge pattern bullish or bearish?

A rising wedge pattern is bearish, despite the upward-sloping shape. The narrowing structure signals fading buying pressure, and the pattern typically resolves with price breaking down through the lower trendline.

How do you trade a rising wedge pattern breakout?

Wait for a full candle to close below the lower trendline, then look for a retest of that broken line from underneath before entering short. Entering the moment price touches the lower line, without waiting for confirmation, leads to far more losing trades.

Where should the stop loss go on a rising wedge pattern?

The stop loss belongs above the most recent swing high inside the wedge, not directly on the trendline itself. On more volatile pairs, adding extra room based on the pair's average true range helps avoid getting stopped out by normal price noise.

How do you calculate the target for a rising wedge pattern?

Measure the height of the widest part of the wedge and project that same distance down from the breakout point. This can be compared against the nearest real support level on the chart, and whichever target sits closer is usually treated as the first target.

What is the difference between a rising wedge and a falling wedge?

A rising wedge slopes upward and is bearish, usually breaking down. A falling wedge slopes downward and is bullish, usually breaking up. Both patterns are traded using the same confluence and entry rules, just in opposite directions.

ezekiel chew asiaforexmentor

About Ezekiel Chew

Ezekiel Chew, founder and head of training at Asia Forex Mentor, is a renowned forex expert, frequently invited to speak at major industry events. Known for his deep market insights, Ezekiel is one of the top traders committed to supporting the trading community. Making six figures per trade, he also trains traders working in banks, fund management, and prop trading firms.

RELATED ARTICLES

Join the Live Event
Get Your Free Ticket Now

I consent to receiving emails and/or text message reminders for this event.

REGISTER FOR THE MASTERCLASS!