Learn To Trade Forex • Best Forex Trading Course • AsiaForexMentor

Inverse Head and Shoulders Pattern Forex Guide

Written by

Ezekiel Chew

Updated on

August 7, 2026

i
Its a default text

Inverse Head and Shoulders Pattern Forex Guide

Written by:

Last updated on:

August 7, 2026

The inverse head and shoulders pattern is not about spotting a pretty shape. It is about catching the exact moment when sellers run out of ammunition.

ABOUT THIS GUIDE

This guide covers the complete inverse head and shoulders pattern for forex traders. It explains how to identify the three-trough structure, how to draw and use the neckline, how to confirm the breakout, how to calculate the pip target, and what mistakes to avoid. Real forex examples with entry, stop, and target levels are included throughout.


QUICK ANSWER

The inverse head and shoulders pattern is a bullish reversal formation that appears at the end of a downtrend. It has three troughs, a deep middle low (the head) flanked by two shallower lows (the shoulders). A confirmed close above the neckline signals the reversal. The pip target equals the head-to-neckline distance projected upward from the breakout point.

What Is the Inverse Head and Shoulders Pattern
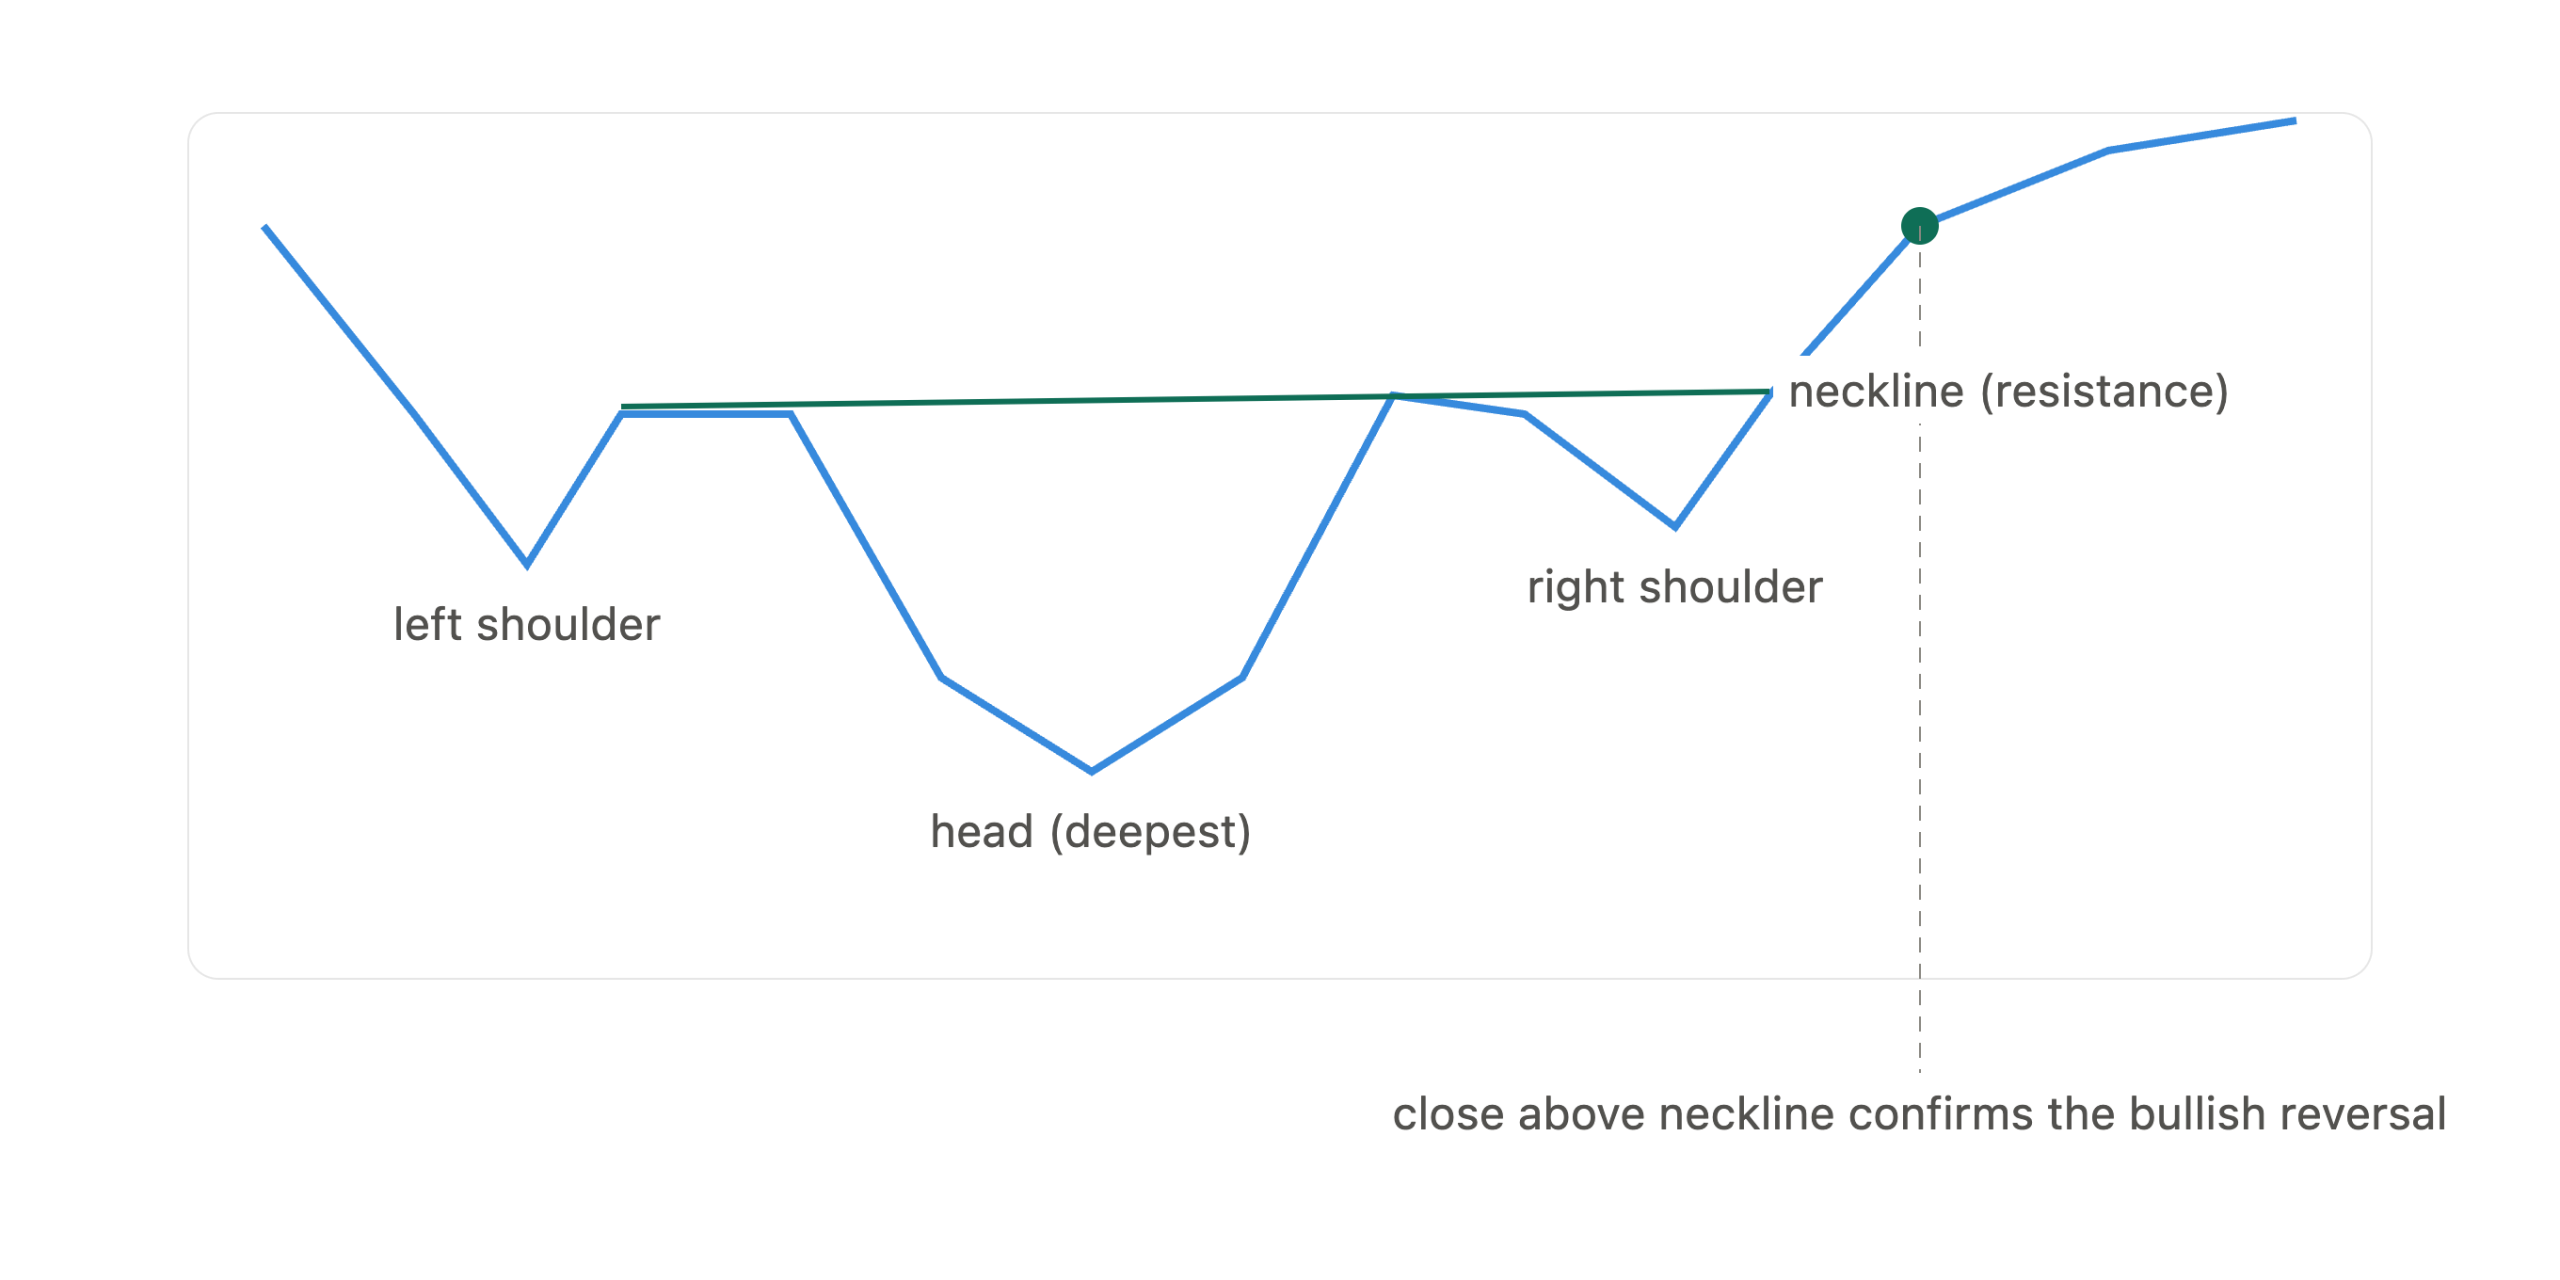
The inverse head and shoulders pattern is a three-trough chart formation that signals the end of a downtrend and the start of a bullish move. It is the mirror image of the standard head and shoulders pattern and one of the most widely recognized bullish reversal signals in technical analysis.

The structure builds from three lows in sequence. Price makes an initial low, rallies briefly, drops to a deeper low, rallies again, then forms a third low that is roughly equal to the first. That sequence creates a shape that looks like an upside-down head with two shoulders on either side.

This pattern matters in price action trading because each trough carries structural evidence. The head shows maximum bearish force. The right shoulder holding above the head shows that force is fading. The neckline break confirms the handoff from sellers to buyers.

The pattern appears across all timeframes and all major forex pairs. It is most reliable on the daily and four-hour charts, where each trough reflects meaningful institutional activity rather than short-term noise.

Why This Pattern Signals a Bullish Reversal

Price tells a story at every stage of the market cycle. In a downtrend, each new low falls below the last and each rally fails to reach the previous peak. The inverse head and shoulders disrupts that sequence in three distinct stages.

The left shoulder forms first. Selling pressure exhausts temporarily, and buyers push price to a reaction high. That reaction high becomes the first anchor point of the neckline. The head forms next, when a second, harder wave of selling drives price to a new low. This is the most aggressive bearish moment in the entire pattern.

The right shoulder is where the story shifts. Sellers attempt to push lower again, but this time they cannot reach the depth of the head. That failure is not incidental. It signals that buyers are absorbing more selling volume at higher prices. Bearish momentum is declining.

Volume reinforces this shift. Selling volume is typically heaviest at the head and lighter at the right shoulder. When the neckline breaks, rising volume confirms that institutional buying has entered the market. Without that volume signal, the breakout carries far less weight.

How to Identify the Three Troughs

The three troughs must each meet specific criteria for the pattern to be valid. Here is what to look for:

  • Left shoulder: The first trough in the sequence. It forms at the end of a downtrend and leads to the first reaction high that anchors the left side of the neckline.
  • Head: The deepest trough of the three. It must fall below the left shoulder low and be clearly the lowest point. A marginal new low that barely undercuts the left shoulder is not a valid head.
  • Right shoulder: The third trough. It forms after the rally from the head and must hold above the head low. A right shoulder that breaks below the head invalidates the pattern.

The two shoulders do not need to be equal in depth or width. Forex markets rarely produce textbook symmetry. What matters is the relative structure: head deepest, both shoulders higher, and the right shoulder's failure to make a new low.

Most retail traders wait for a perfectly symmetrical shape. The more useful filter is whether the right shoulder fails to reach the head's depth. That structural failure is the signal. An asymmetric pattern with a clear right-shoulder failure is more tradeable than a symmetric pattern with a weak, low-volume breakout.

How to Draw the Neckline

The neckline connects the two reaction highs formed between the three troughs. Drawing it correctly determines both the breakout trigger and the pip target calculation.

Here are the steps:

  1. Locate the reaction high that formed between the left shoulder low and the head low. Mark that price level precisely on the chart.
  2. Locate the reaction high that formed between the head low and the right shoulder low. Mark that level.
  3. Connect both points with a straight line and extend it to the right across the chart.

The neckline may be horizontal, slope upward, or slope downward. A horizontal neckline is the cleanest setup and the easiest to trade with precision. A downward-sloping neckline that breaks to the upside is a strong signal because buyers are overcoming actively declining resistance.

The neckline serves two roles in the trade. Before the breakout, it is resistance. After the breakout, it becomes support. When price retests the neckline from above and holds, the pattern gains a second layer of structural confirmation. That retest is one of the most reliable entry points in reversal trading setups.

Inverse Head and Shoulders vs Head and Shoulders
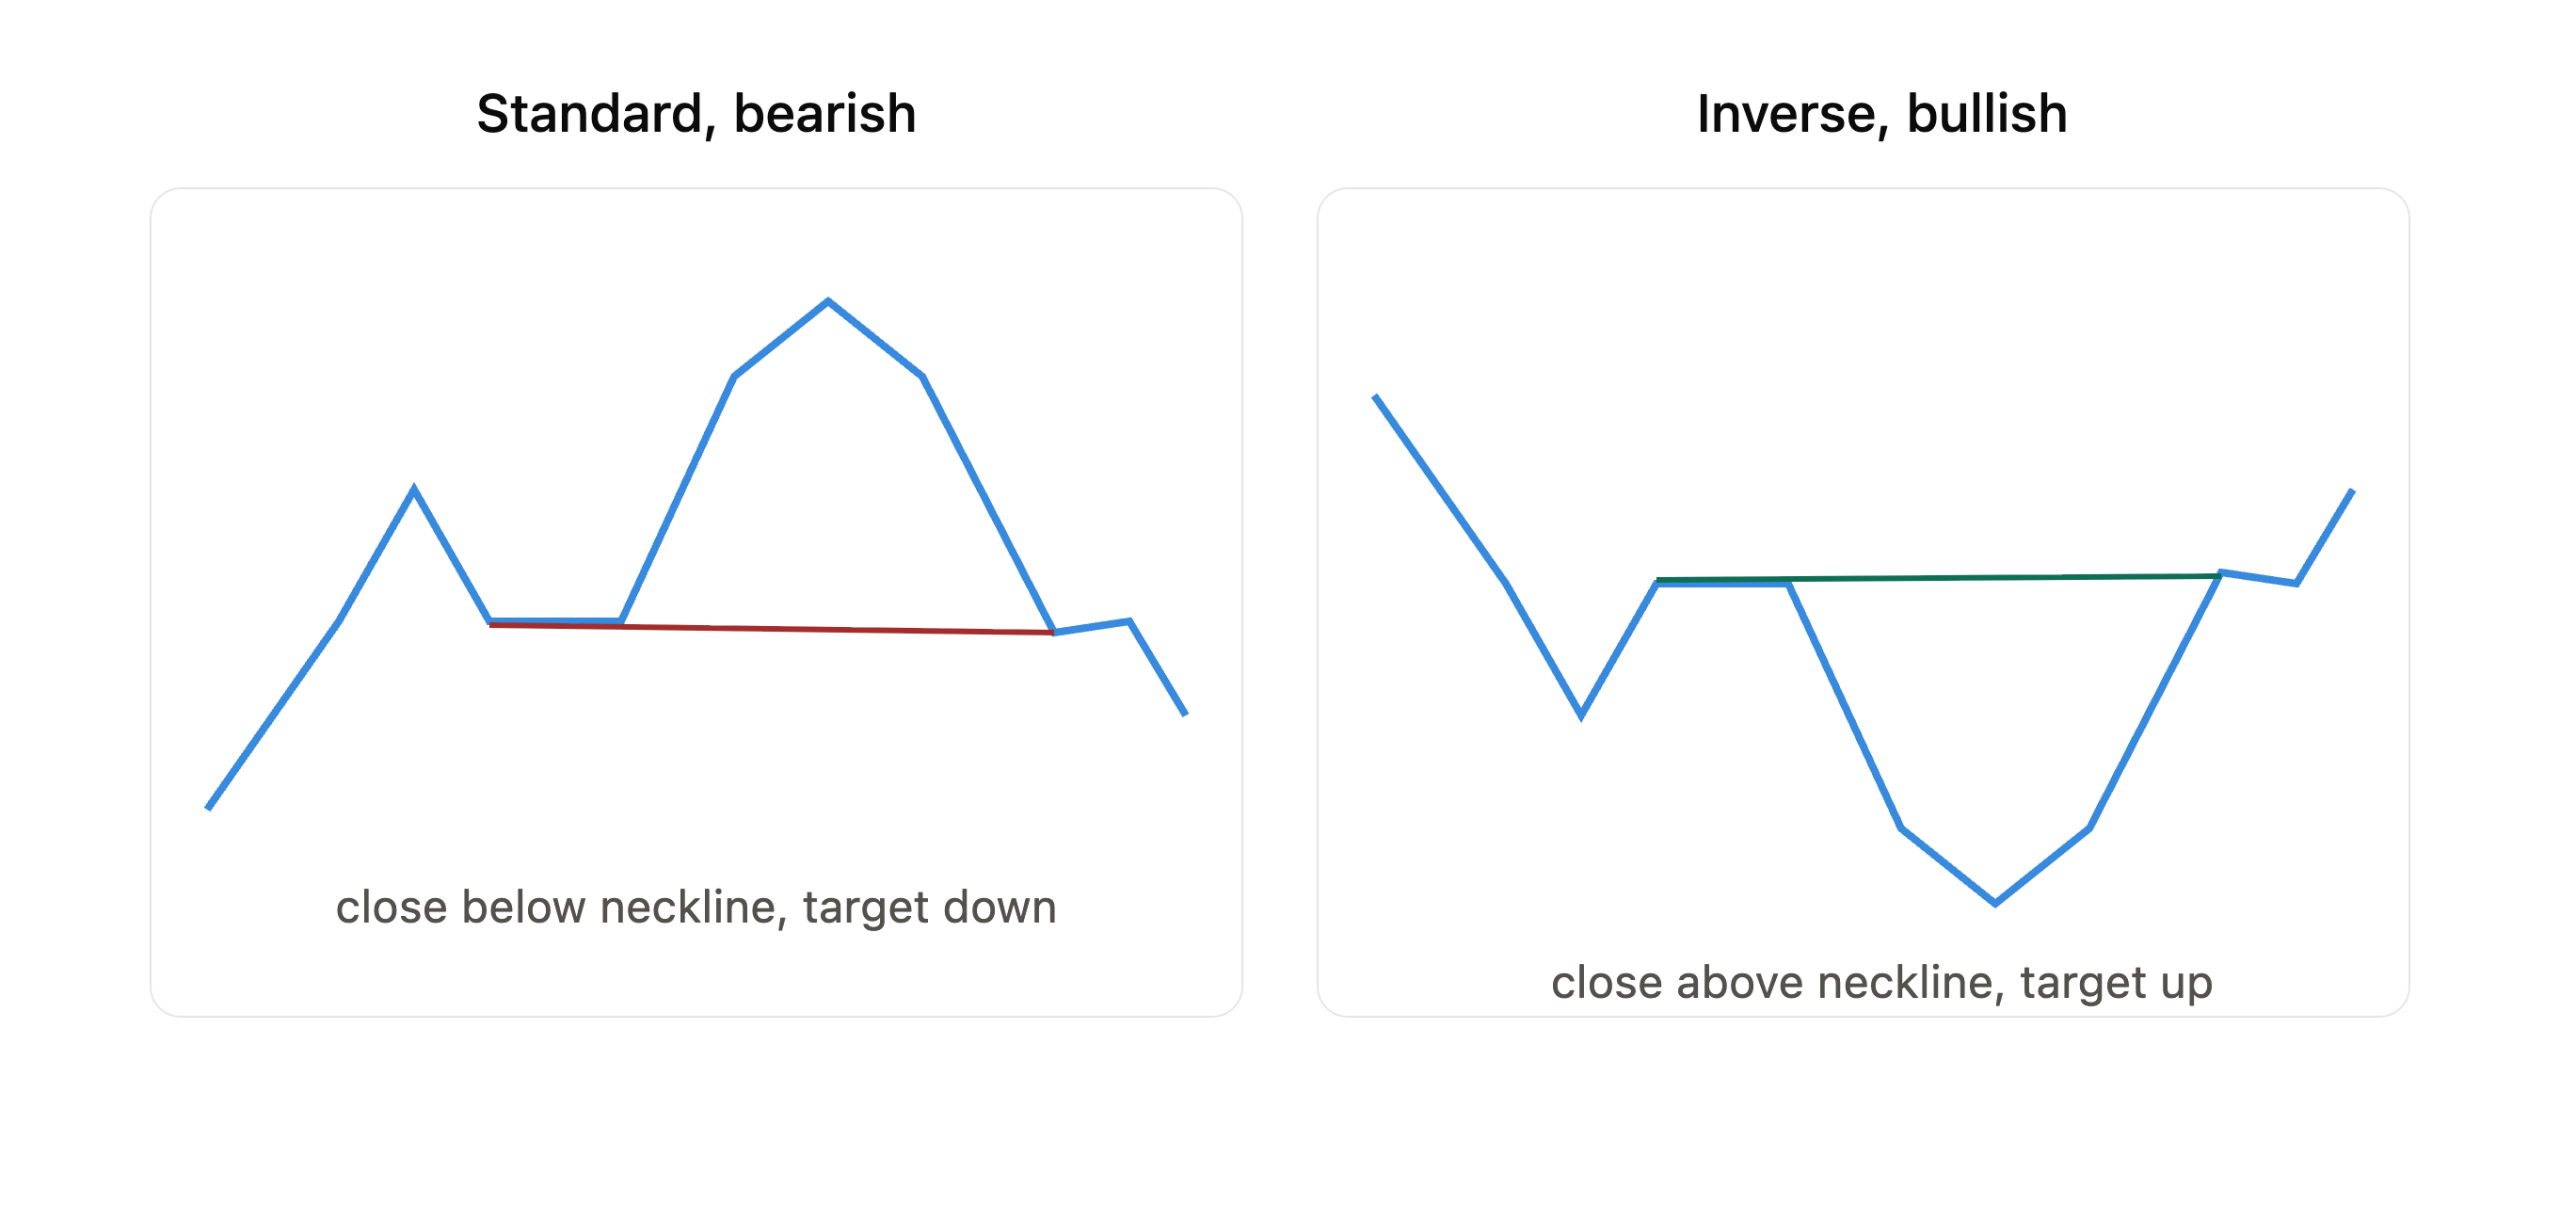
The two patterns use the same measured move logic. They differ only in market context and direction. Here is a side-by-side comparison:

Feature Head and Shoulders Inverse Head and Shoulders
Market context Appears at top of uptrend Appears at bottom of downtrend
Signal direction Bearish reversal Bullish reversal
Three key levels Three peaks Three troughs
Neckline connects Two reaction lows Two reaction highs
Breakout direction Close below neckline Close above neckline
Stop placement Above right shoulder high Below right shoulder low
Target direction Neckline minus head distance Neckline plus head distance

Knowing both patterns matters because they often appear at opposite ends of the same major trend. An inverse head and shoulders that launches a new uptrend may eventually form a standard head and shoulders when that uptrend peaks. The two work together as a natural cluster.

Market structure analysis confirms which pattern is forming. A sequence of lower lows and lower highs supports a bearish head and shoulders setup. A sequence of failed lower lows developing at the base supports the inverse.

Breakout Confirmation and Entry Rules
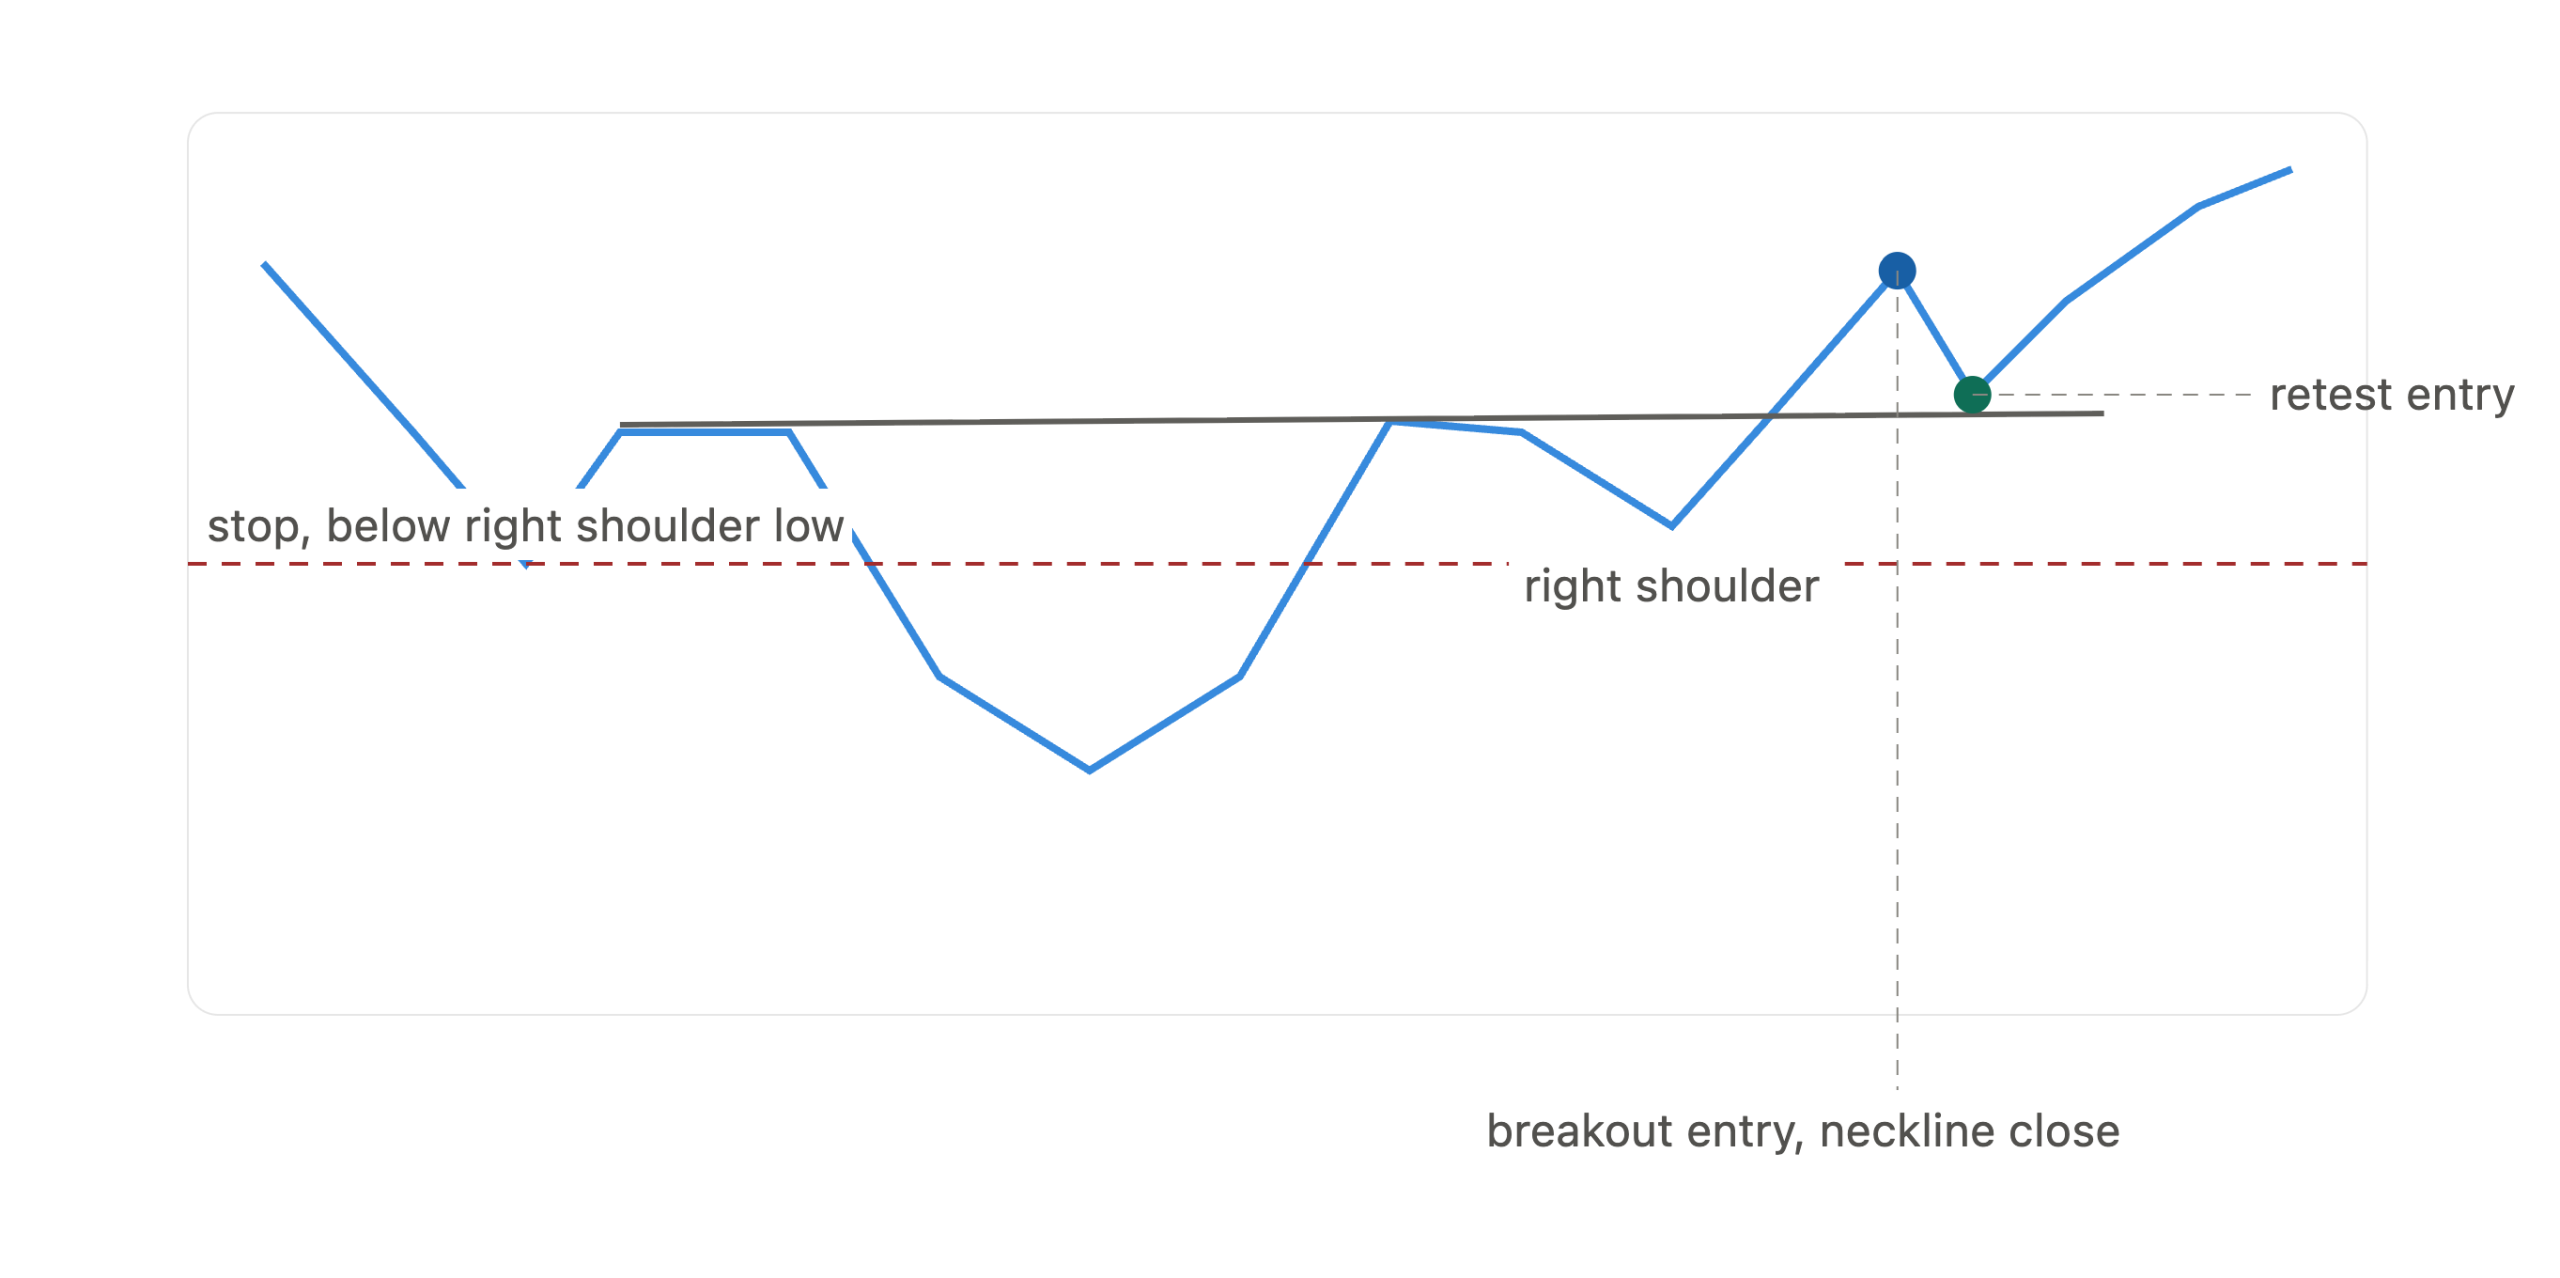
A candlestick body closing above the neckline on the daily or four-hour chart is the minimum requirement for confirmation. A single wick printing above the neckline without a full candle body close is not confirmation. Wicks can spike above any level without committing price to a new direction.

Volume is the second filter. A breakout candle with above-average volume indicates institutional participation. Low-volume breakouts are prone to reversal, particularly during off-session hours when liquidity thins out on currency pairs.

There are two valid entry approaches for trading this pattern:

Breakout entry. Enter when the breakout candle closes above the neckline. This approach captures the full measured move but carries higher false-breakout risk on pairs that print spiky price action.

Retest entry. Wait for price to pull back and test the neckline as support after the initial break. Enter when the retest holds. This improves the risk-to-reward ratio and adds structural confirmation that the neckline has flipped from resistance to support. The only risk is missing the trade if price does not retrace.

Asia Forex Mentor's analysis consistently favors the retest entry for this pattern. A neckline that holds as support after the breakout adds structural confirmation on top of the pattern signal. That layering of evidence separates high-probability setups from marginal ones.

Where to Place Your Stop Loss

The stop loss goes below the right shoulder low. The logic is direct: if price breaks the right shoulder low after the neckline breakout, the pattern has failed. Sellers have reasserted control and the bullish thesis is no longer valid.

Place the stop a few pips below the right shoulder low, not exactly at it. That buffer absorbs spread and minor fluctuation without exposing the trade to normal volatility. Setting the stop right at the right shoulder level leaves no room for intrabar noise.

Some traders place the stop below the head rather than the right shoulder. This widens risk significantly and typically produces a risk-to-reward ratio below 1:1.5, which weakens the trade's justification. The right shoulder is the most recent structural low before the breakout and the correct reference in every case.

A tight stop below the right shoulder, combined with the full measured move as the target, typically produces risk-to-reward ratios between 1:1.5 and 1:2.5 depending on the pair and timeframe. That is a meaningful edge over time.

How to Calculate Your Pip Target

The pip target uses the measured move technique. The calculation projects the pattern's height upward from the breakout point. Here are the three steps:

  1. Measure the distance in pips from the head low to the neckline directly above it.
  2. Identify the exact price where the neckline breakout occurs.
  3. Add the head-to-neckline pip distance to the breakout price.

The formula expressed simply: Target = Breakout Price + (Neckline Price minus Head Price)

For example: the head sits at 1.2000, the neckline at 1.2150, and the breakout occurs at 1.2155. The head-to-neckline distance is 150 pips. The target is 1.2155 + 150 = 1.2305.

This gives a conservative minimum target. In a strong trending market, price often travels well beyond the measured move projection. In choppy or range-bound conditions, price may stall short of it. The CME Group's educational resources on technical chart patterns document the measured move as the industry-standard projection method across pattern types.

Use the projection as a reference and manage the trade as it develops. Partial profit-taking at the measured target with a trailing stop on the remainder is a common approach for maximizing the full move.

Real Forex Examples With Entry, Stop, and Target

Two setups illustrate how the inverse head and shoulders pattern appears in live forex trading across different pairs and timeframes.

EUR/USD Daily Chart

In a typical EUR/USD daily setup, price forms the left shoulder after a sustained downtrend, drops to the head, then forms the right shoulder above the head's low before breaking the neckline with a strong daily close.

Level Price
Head low 1.0580
Neckline 1.0740
Head-to-neckline distance 160 pips
Breakout point 1.0745
Stop loss (below right shoulder) 1.0620
Pip target 1.0905

The breakout entry at 1.0745 risks 125 pips to the stop at 1.0620. The target at 1.0905 returns 160 pips. Risk-to-reward is 1:1.28. A retest entry at 1.0750 with the same stop reduces the risk-to-reward calculation slightly but adds confirmation that the neckline is holding as support.

GBP/USD Four-Hour Chart

Consider a GBP/USD setup on the four-hour chart, where price action tends to be more volatile. In this kind of setup, the retest entry often produces cleaner risk-to-reward on this pair.

Level Price
Head low 1.0580
Right shoulder low 1.0635
Neckline 1.0740
Head-to-neckline distance 160 pips
Breakout point 1.0745
Stop loss (below right shoulder) 1.0620
Pip target 1.0905

The retest entry at 1.2625 risks 85 pips. The target at 1.2765 returns 140 pips. Risk-to-reward is 1:1.65. That improvement over a breakout entry comes entirely from waiting for the neckline to confirm as support before entering.

Developing the ability to read these setups across timeframes starts with knowing how to read forex charts and identify structural patterns as they form, not after they have already resolved.

Common Mistakes That Cause Failed Trades

Most failed inverse head and shoulders trades trace back to six specific errors. Here they are:

  • Entering before the neckline breaks. Anticipating the breakout inside the right shoulder region is the most costly error. Price frequently dips back toward the head before the real breakout occurs. Early entries get stopped out before the move begins.
  • Identifying the pattern in the wrong context. The inverse head and shoulders requires a clear downtrend before it forms. A three-trough structure inside a sideways range or minor pullback is not a valid reversal setup.
  • Ignoring volume on the breakout candle. A neckline break on thin volume during an off-peak session is a warning, not a signal. Volume is the most important secondary confirmation for the breakout.
  • Drawing the neckline through the wrong swing highs. Connecting the wrong reaction highs shifts the breakout trigger and corrupts the pip target calculation. Take time to identify the precise reaction highs between each trough before drawing the line.
  • Setting the stop below the head. This widens risk without structural justification. The right shoulder low is the correct stop reference in every case.
  • Skipping the broader market context check. A valid pattern during a period of macro currency headwinds needs additional confirmation. The pattern and the macro backdrop must align.

Pairing the inverse head and shoulders with candlestick confirmation signals at the neckline breakout is one of the most practical ways to filter false entries before they cost capital.

Also Read:  Fibonacci Extension Strategy: How to Set Precise Profit Targets

Conclusion

The inverse head and shoulders pattern gives forex traders a clear, structured way to identify when a downtrend is ending. The three-trough structure, the neckline, and the measured move target work together to define where the trend broke down, where momentum shifted, and how far the new move can run.

Confirmation is the most important variable. A full candlestick close above the neckline with volume behind it is worth waiting for. The retest entry, where the neckline holds as new support, consistently produces better risk-to-reward setups than entries taken directly on the breakout candle.

Frequently Asked Questions

What Is the Inverse Head and Shoulders Pattern in Forex?

The inverse head and shoulders pattern is a bullish reversal chart formation that appears at the end of a downtrend. It consists of three troughs: a deep middle low (the head) flanked by two shallower lows (the shoulders). A candlestick close above the neckline confirms the pattern and signals the start of an upward move. It is the mirror image of the bearish head and shoulders pattern.

Where Does the Stop Loss Go on an Inverse Head and Shoulders Trade?

The stop loss goes below the right shoulder low. If price breaks the right shoulder after the neckline breakout, the pattern has failed and sellers have reasserted control. Place the stop a few pips below the right shoulder low to account for spread and minor fluctuation. Setting the stop below the head instead widens risk significantly and produces a weaker risk-to-reward ratio.

How Do You Calculate the Pip Target for an Inverse Head and Shoulders?

Measure the distance in pips from the head low to the neckline directly above it. Add that distance to the price where the neckline breakout occurs. That sum is the minimum pip target. For example, a head-to-neckline distance of 150 pips with a breakout at 1.2200 gives a target of 1.2350. This is a conservative projection; strong trends often extend well beyond it.

What Is the Difference Between the Inverse Head and Shoulders and the Regular Head and Shoulders?

The regular head and shoulders appears at the top of an uptrend and signals a bearish reversal. It has three peaks, with the middle peak being the highest. The inverse head and shoulders is its mirror image: it appears at the bottom of a downtrend, has three troughs with the middle trough being the deepest, and signals a bullish reversal. Both patterns use the same measured move calculation applied in opposite directions.

What Timeframes Work Best for the Inverse Head and Shoulders in Forex?

The daily and four-hour charts produce the most reliable inverse head and shoulders setups in forex trading. Patterns on these timeframes reflect meaningful institutional activity and are far less exposed to short-term noise. Lower timeframes such as the one-hour chart can be used for entry timing once the setup is confirmed on the higher timeframe. Patterns on timeframes below one hour carry much higher failure rates.


About Ezekiel Chew​

Ezekiel Chew, founder and head of training at Asia Forex Mentor, is a renowned forex expert, frequently invited to speak at major industry events. Known for his deep market insights, Ezekiel is one of the top traders committed to supporting the trading community. Making six figures per trade, he also trains traders working in banks, fund management, and prop trading firms.

AFM Trading Summit Live

Date: Coming Soon

Join us at the AFM Trading Summit Live and learn from top industry experts through live trading sessions, market insights, and actionable strategies.

Inverse Head and Shoulders Pattern Forex Guide

4.0
Overall Trust Index

Written by:

Updated:

August 7, 2026
The inverse head and shoulders pattern is not about spotting a pretty shape. It is about catching the exact moment when sellers run out of ammunition.

ABOUT THIS GUIDE

This guide covers the complete inverse head and shoulders pattern for forex traders. It explains how to identify the three-trough structure, how to draw and use the neckline, how to confirm the breakout, how to calculate the pip target, and what mistakes to avoid. Real forex examples with entry, stop, and target levels are included throughout.
 

QUICK ANSWER

The inverse head and shoulders pattern is a bullish reversal formation that appears at the end of a downtrend. It has three troughs, a deep middle low (the head) flanked by two shallower lows (the shoulders). A confirmed close above the neckline signals the reversal. The pip target equals the head-to-neckline distance projected upward from the breakout point.

What Is the Inverse Head and Shoulders Pattern

The inverse head and shoulders pattern is a three-trough chart formation that signals the end of a downtrend and the start of a bullish move. It is the mirror image of the standard head and shoulders pattern and one of the most widely recognized bullish reversal signals in technical analysis. The structure builds from three lows in sequence. Price makes an initial low, rallies briefly, drops to a deeper low, rallies again, then forms a third low that is roughly equal to the first. That sequence creates a shape that looks like an upside-down head with two shoulders on either side. This pattern matters in price action trading because each trough carries structural evidence. The head shows maximum bearish force. The right shoulder holding above the head shows that force is fading. The neckline break confirms the handoff from sellers to buyers. The pattern appears across all timeframes and all major forex pairs. It is most reliable on the daily and four-hour charts, where each trough reflects meaningful institutional activity rather than short-term noise.

Why This Pattern Signals a Bullish Reversal

Price tells a story at every stage of the market cycle. In a downtrend, each new low falls below the last and each rally fails to reach the previous peak. The inverse head and shoulders disrupts that sequence in three distinct stages. The left shoulder forms first. Selling pressure exhausts temporarily, and buyers push price to a reaction high. That reaction high becomes the first anchor point of the neckline. The head forms next, when a second, harder wave of selling drives price to a new low. This is the most aggressive bearish moment in the entire pattern. The right shoulder is where the story shifts. Sellers attempt to push lower again, but this time they cannot reach the depth of the head. That failure is not incidental. It signals that buyers are absorbing more selling volume at higher prices. Bearish momentum is declining. Volume reinforces this shift. Selling volume is typically heaviest at the head and lighter at the right shoulder. When the neckline breaks, rising volume confirms that institutional buying has entered the market. Without that volume signal, the breakout carries far less weight.

How to Identify the Three Troughs

The three troughs must each meet specific criteria for the pattern to be valid. Here is what to look for:
  • Left shoulder: The first trough in the sequence. It forms at the end of a downtrend and leads to the first reaction high that anchors the left side of the neckline.
  • Head: The deepest trough of the three. It must fall below the left shoulder low and be clearly the lowest point. A marginal new low that barely undercuts the left shoulder is not a valid head.
  • Right shoulder: The third trough. It forms after the rally from the head and must hold above the head low. A right shoulder that breaks below the head invalidates the pattern.
The two shoulders do not need to be equal in depth or width. Forex markets rarely produce textbook symmetry. What matters is the relative structure: head deepest, both shoulders higher, and the right shoulder's failure to make a new low. Most retail traders wait for a perfectly symmetrical shape. The more useful filter is whether the right shoulder fails to reach the head's depth. That structural failure is the signal. An asymmetric pattern with a clear right-shoulder failure is more tradeable than a symmetric pattern with a weak, low-volume breakout.

How to Draw the Neckline

The neckline connects the two reaction highs formed between the three troughs. Drawing it correctly determines both the breakout trigger and the pip target calculation. Here are the steps:
  1. Locate the reaction high that formed between the left shoulder low and the head low. Mark that price level precisely on the chart.
  2. Locate the reaction high that formed between the head low and the right shoulder low. Mark that level.
  3. Connect both points with a straight line and extend it to the right across the chart.
The neckline may be horizontal, slope upward, or slope downward. A horizontal neckline is the cleanest setup and the easiest to trade with precision. A downward-sloping neckline that breaks to the upside is a strong signal because buyers are overcoming actively declining resistance. The neckline serves two roles in the trade. Before the breakout, it is resistance. After the breakout, it becomes support. When price retests the neckline from above and holds, the pattern gains a second layer of structural confirmation. That retest is one of the most reliable entry points in reversal trading setups.

Inverse Head and Shoulders vs Head and Shoulders

The two patterns use the same measured move logic. They differ only in market context and direction. Here is a side-by-side comparison:
Feature Head and Shoulders Inverse Head and Shoulders
Market context Appears at top of uptrend Appears at bottom of downtrend
Signal direction Bearish reversal Bullish reversal
Three key levels Three peaks Three troughs
Neckline connects Two reaction lows Two reaction highs
Breakout direction Close below neckline Close above neckline
Stop placement Above right shoulder high Below right shoulder low
Target direction Neckline minus head distance Neckline plus head distance
Knowing both patterns matters because they often appear at opposite ends of the same major trend. An inverse head and shoulders that launches a new uptrend may eventually form a standard head and shoulders when that uptrend peaks. The two work together as a natural cluster. Market structure analysis confirms which pattern is forming. A sequence of lower lows and lower highs supports a bearish head and shoulders setup. A sequence of failed lower lows developing at the base supports the inverse.

Breakout Confirmation and Entry Rules

A candlestick body closing above the neckline on the daily or four-hour chart is the minimum requirement for confirmation. A single wick printing above the neckline without a full candle body close is not confirmation. Wicks can spike above any level without committing price to a new direction. Volume is the second filter. A breakout candle with above-average volume indicates institutional participation. Low-volume breakouts are prone to reversal, particularly during off-session hours when liquidity thins out on currency pairs. There are two valid entry approaches for trading this pattern: Breakout entry. Enter when the breakout candle closes above the neckline. This approach captures the full measured move but carries higher false-breakout risk on pairs that print spiky price action. Retest entry. Wait for price to pull back and test the neckline as support after the initial break. Enter when the retest holds. This improves the risk-to-reward ratio and adds structural confirmation that the neckline has flipped from resistance to support. The only risk is missing the trade if price does not retrace. Asia Forex Mentor's analysis consistently favors the retest entry for this pattern. A neckline that holds as support after the breakout adds structural confirmation on top of the pattern signal. That layering of evidence separates high-probability setups from marginal ones.

Where to Place Your Stop Loss

The stop loss goes below the right shoulder low. The logic is direct: if price breaks the right shoulder low after the neckline breakout, the pattern has failed. Sellers have reasserted control and the bullish thesis is no longer valid. Place the stop a few pips below the right shoulder low, not exactly at it. That buffer absorbs spread and minor fluctuation without exposing the trade to normal volatility. Setting the stop right at the right shoulder level leaves no room for intrabar noise. Some traders place the stop below the head rather than the right shoulder. This widens risk significantly and typically produces a risk-to-reward ratio below 1:1.5, which weakens the trade's justification. The right shoulder is the most recent structural low before the breakout and the correct reference in every case. A tight stop below the right shoulder, combined with the full measured move as the target, typically produces risk-to-reward ratios between 1:1.5 and 1:2.5 depending on the pair and timeframe. That is a meaningful edge over time.

How to Calculate Your Pip Target

The pip target uses the measured move technique. The calculation projects the pattern's height upward from the breakout point. Here are the three steps:
  1. Measure the distance in pips from the head low to the neckline directly above it.
  2. Identify the exact price where the neckline breakout occurs.
  3. Add the head-to-neckline pip distance to the breakout price.
The formula expressed simply: Target = Breakout Price + (Neckline Price minus Head Price) For example: the head sits at 1.2000, the neckline at 1.2150, and the breakout occurs at 1.2155. The head-to-neckline distance is 150 pips. The target is 1.2155 + 150 = 1.2305. This gives a conservative minimum target. In a strong trending market, price often travels well beyond the measured move projection. In choppy or range-bound conditions, price may stall short of it. The CME Group's educational resources on technical chart patterns document the measured move as the industry-standard projection method across pattern types. Use the projection as a reference and manage the trade as it develops. Partial profit-taking at the measured target with a trailing stop on the remainder is a common approach for maximizing the full move.

Real Forex Examples With Entry, Stop, and Target

Two setups illustrate how the inverse head and shoulders pattern appears in live forex trading across different pairs and timeframes. EUR/USD Daily Chart In a typical EUR/USD daily setup, price forms the left shoulder after a sustained downtrend, drops to the head, then forms the right shoulder above the head's low before breaking the neckline with a strong daily close.
Level Price
Head low 1.0580
Neckline 1.0740
Head-to-neckline distance 160 pips
Breakout point 1.0745
Stop loss (below right shoulder) 1.0620
Pip target 1.0905
The breakout entry at 1.0745 risks 125 pips to the stop at 1.0620. The target at 1.0905 returns 160 pips. Risk-to-reward is 1:1.28. A retest entry at 1.0750 with the same stop reduces the risk-to-reward calculation slightly but adds confirmation that the neckline is holding as support. GBP/USD Four-Hour Chart Consider a GBP/USD setup on the four-hour chart, where price action tends to be more volatile. In this kind of setup, the retest entry often produces cleaner risk-to-reward on this pair.
Level Price
Head low 1.0580
Right shoulder low 1.0635
Neckline 1.0740
Head-to-neckline distance 160 pips
Breakout point 1.0745
Stop loss (below right shoulder) 1.0620
Pip target 1.0905
The retest entry at 1.2625 risks 85 pips. The target at 1.2765 returns 140 pips. Risk-to-reward is 1:1.65. That improvement over a breakout entry comes entirely from waiting for the neckline to confirm as support before entering. Developing the ability to read these setups across timeframes starts with knowing how to read forex charts and identify structural patterns as they form, not after they have already resolved.

Common Mistakes That Cause Failed Trades

Most failed inverse head and shoulders trades trace back to six specific errors. Here they are:
  • Entering before the neckline breaks. Anticipating the breakout inside the right shoulder region is the most costly error. Price frequently dips back toward the head before the real breakout occurs. Early entries get stopped out before the move begins.
  • Identifying the pattern in the wrong context. The inverse head and shoulders requires a clear downtrend before it forms. A three-trough structure inside a sideways range or minor pullback is not a valid reversal setup.
  • Ignoring volume on the breakout candle. A neckline break on thin volume during an off-peak session is a warning, not a signal. Volume is the most important secondary confirmation for the breakout.
  • Drawing the neckline through the wrong swing highs. Connecting the wrong reaction highs shifts the breakout trigger and corrupts the pip target calculation. Take time to identify the precise reaction highs between each trough before drawing the line.
  • Setting the stop below the head. This widens risk without structural justification. The right shoulder low is the correct stop reference in every case.
  • Skipping the broader market context check. A valid pattern during a period of macro currency headwinds needs additional confirmation. The pattern and the macro backdrop must align.
Pairing the inverse head and shoulders with candlestick confirmation signals at the neckline breakout is one of the most practical ways to filter false entries before they cost capital.

Also Read:  Fibonacci Extension Strategy: How to Set Precise Profit Targets

Conclusion

The inverse head and shoulders pattern gives forex traders a clear, structured way to identify when a downtrend is ending. The three-trough structure, the neckline, and the measured move target work together to define where the trend broke down, where momentum shifted, and how far the new move can run. Confirmation is the most important variable. A full candlestick close above the neckline with volume behind it is worth waiting for. The retest entry, where the neckline holds as new support, consistently produces better risk-to-reward setups than entries taken directly on the breakout candle.

Frequently Asked Questions

What Is the Inverse Head and Shoulders Pattern in Forex?

The inverse head and shoulders pattern is a bullish reversal chart formation that appears at the end of a downtrend. It consists of three troughs: a deep middle low (the head) flanked by two shallower lows (the shoulders). A candlestick close above the neckline confirms the pattern and signals the start of an upward move. It is the mirror image of the bearish head and shoulders pattern.

Where Does the Stop Loss Go on an Inverse Head and Shoulders Trade?

The stop loss goes below the right shoulder low. If price breaks the right shoulder after the neckline breakout, the pattern has failed and sellers have reasserted control. Place the stop a few pips below the right shoulder low to account for spread and minor fluctuation. Setting the stop below the head instead widens risk significantly and produces a weaker risk-to-reward ratio.

How Do You Calculate the Pip Target for an Inverse Head and Shoulders?

Measure the distance in pips from the head low to the neckline directly above it. Add that distance to the price where the neckline breakout occurs. That sum is the minimum pip target. For example, a head-to-neckline distance of 150 pips with a breakout at 1.2200 gives a target of 1.2350. This is a conservative projection; strong trends often extend well beyond it.

What Is the Difference Between the Inverse Head and Shoulders and the Regular Head and Shoulders?

The regular head and shoulders appears at the top of an uptrend and signals a bearish reversal. It has three peaks, with the middle peak being the highest. The inverse head and shoulders is its mirror image: it appears at the bottom of a downtrend, has three troughs with the middle trough being the deepest, and signals a bullish reversal. Both patterns use the same measured move calculation applied in opposite directions.

What Timeframes Work Best for the Inverse Head and Shoulders in Forex?

The daily and four-hour charts produce the most reliable inverse head and shoulders setups in forex trading. Patterns on these timeframes reflect meaningful institutional activity and are far less exposed to short-term noise. Lower timeframes such as the one-hour chart can be used for entry timing once the setup is confirmed on the higher timeframe. Patterns on timeframes below one hour carry much higher failure rates.

ezekiel chew asiaforexmentor

About Ezekiel Chew

Ezekiel Chew, founder and head of training at Asia Forex Mentor, is a renowned forex expert, frequently invited to speak at major industry events. Known for his deep market insights, Ezekiel is one of the top traders committed to supporting the trading community. Making six figures per trade, he also trains traders working in banks, fund management, and prop trading firms.

RELATED ARTICLES

Inverse Head and Shoulders Pattern Forex Guide

4.0
Overall Trust Index

Written by:

Updated:

August 7, 2026
The inverse head and shoulders pattern is not about spotting a pretty shape. It is about catching the exact moment when sellers run out of ammunition.

ABOUT THIS GUIDE

This guide covers the complete inverse head and shoulders pattern for forex traders. It explains how to identify the three-trough structure, how to draw and use the neckline, how to confirm the breakout, how to calculate the pip target, and what mistakes to avoid. Real forex examples with entry, stop, and target levels are included throughout.
 

QUICK ANSWER

The inverse head and shoulders pattern is a bullish reversal formation that appears at the end of a downtrend. It has three troughs, a deep middle low (the head) flanked by two shallower lows (the shoulders). A confirmed close above the neckline signals the reversal. The pip target equals the head-to-neckline distance projected upward from the breakout point.

What Is the Inverse Head and Shoulders Pattern

The inverse head and shoulders pattern is a three-trough chart formation that signals the end of a downtrend and the start of a bullish move. It is the mirror image of the standard head and shoulders pattern and one of the most widely recognized bullish reversal signals in technical analysis. The structure builds from three lows in sequence. Price makes an initial low, rallies briefly, drops to a deeper low, rallies again, then forms a third low that is roughly equal to the first. That sequence creates a shape that looks like an upside-down head with two shoulders on either side. This pattern matters in price action trading because each trough carries structural evidence. The head shows maximum bearish force. The right shoulder holding above the head shows that force is fading. The neckline break confirms the handoff from sellers to buyers. The pattern appears across all timeframes and all major forex pairs. It is most reliable on the daily and four-hour charts, where each trough reflects meaningful institutional activity rather than short-term noise.

Why This Pattern Signals a Bullish Reversal

Price tells a story at every stage of the market cycle. In a downtrend, each new low falls below the last and each rally fails to reach the previous peak. The inverse head and shoulders disrupts that sequence in three distinct stages. The left shoulder forms first. Selling pressure exhausts temporarily, and buyers push price to a reaction high. That reaction high becomes the first anchor point of the neckline. The head forms next, when a second, harder wave of selling drives price to a new low. This is the most aggressive bearish moment in the entire pattern. The right shoulder is where the story shifts. Sellers attempt to push lower again, but this time they cannot reach the depth of the head. That failure is not incidental. It signals that buyers are absorbing more selling volume at higher prices. Bearish momentum is declining. Volume reinforces this shift. Selling volume is typically heaviest at the head and lighter at the right shoulder. When the neckline breaks, rising volume confirms that institutional buying has entered the market. Without that volume signal, the breakout carries far less weight.

How to Identify the Three Troughs

The three troughs must each meet specific criteria for the pattern to be valid. Here is what to look for:
  • Left shoulder: The first trough in the sequence. It forms at the end of a downtrend and leads to the first reaction high that anchors the left side of the neckline.
  • Head: The deepest trough of the three. It must fall below the left shoulder low and be clearly the lowest point. A marginal new low that barely undercuts the left shoulder is not a valid head.
  • Right shoulder: The third trough. It forms after the rally from the head and must hold above the head low. A right shoulder that breaks below the head invalidates the pattern.
The two shoulders do not need to be equal in depth or width. Forex markets rarely produce textbook symmetry. What matters is the relative structure: head deepest, both shoulders higher, and the right shoulder's failure to make a new low. Most retail traders wait for a perfectly symmetrical shape. The more useful filter is whether the right shoulder fails to reach the head's depth. That structural failure is the signal. An asymmetric pattern with a clear right-shoulder failure is more tradeable than a symmetric pattern with a weak, low-volume breakout.

How to Draw the Neckline

The neckline connects the two reaction highs formed between the three troughs. Drawing it correctly determines both the breakout trigger and the pip target calculation. Here are the steps:
  1. Locate the reaction high that formed between the left shoulder low and the head low. Mark that price level precisely on the chart.
  2. Locate the reaction high that formed between the head low and the right shoulder low. Mark that level.
  3. Connect both points with a straight line and extend it to the right across the chart.
The neckline may be horizontal, slope upward, or slope downward. A horizontal neckline is the cleanest setup and the easiest to trade with precision. A downward-sloping neckline that breaks to the upside is a strong signal because buyers are overcoming actively declining resistance. The neckline serves two roles in the trade. Before the breakout, it is resistance. After the breakout, it becomes support. When price retests the neckline from above and holds, the pattern gains a second layer of structural confirmation. That retest is one of the most reliable entry points in reversal trading setups.

Inverse Head and Shoulders vs Head and Shoulders

The two patterns use the same measured move logic. They differ only in market context and direction. Here is a side-by-side comparison:
Feature Head and Shoulders Inverse Head and Shoulders
Market context Appears at top of uptrend Appears at bottom of downtrend
Signal direction Bearish reversal Bullish reversal
Three key levels Three peaks Three troughs
Neckline connects Two reaction lows Two reaction highs
Breakout direction Close below neckline Close above neckline
Stop placement Above right shoulder high Below right shoulder low
Target direction Neckline minus head distance Neckline plus head distance
Knowing both patterns matters because they often appear at opposite ends of the same major trend. An inverse head and shoulders that launches a new uptrend may eventually form a standard head and shoulders when that uptrend peaks. The two work together as a natural cluster. Market structure analysis confirms which pattern is forming. A sequence of lower lows and lower highs supports a bearish head and shoulders setup. A sequence of failed lower lows developing at the base supports the inverse.

Breakout Confirmation and Entry Rules

A candlestick body closing above the neckline on the daily or four-hour chart is the minimum requirement for confirmation. A single wick printing above the neckline without a full candle body close is not confirmation. Wicks can spike above any level without committing price to a new direction. Volume is the second filter. A breakout candle with above-average volume indicates institutional participation. Low-volume breakouts are prone to reversal, particularly during off-session hours when liquidity thins out on currency pairs. There are two valid entry approaches for trading this pattern: Breakout entry. Enter when the breakout candle closes above the neckline. This approach captures the full measured move but carries higher false-breakout risk on pairs that print spiky price action. Retest entry. Wait for price to pull back and test the neckline as support after the initial break. Enter when the retest holds. This improves the risk-to-reward ratio and adds structural confirmation that the neckline has flipped from resistance to support. The only risk is missing the trade if price does not retrace. Asia Forex Mentor's analysis consistently favors the retest entry for this pattern. A neckline that holds as support after the breakout adds structural confirmation on top of the pattern signal. That layering of evidence separates high-probability setups from marginal ones.

Where to Place Your Stop Loss

The stop loss goes below the right shoulder low. The logic is direct: if price breaks the right shoulder low after the neckline breakout, the pattern has failed. Sellers have reasserted control and the bullish thesis is no longer valid. Place the stop a few pips below the right shoulder low, not exactly at it. That buffer absorbs spread and minor fluctuation without exposing the trade to normal volatility. Setting the stop right at the right shoulder level leaves no room for intrabar noise. Some traders place the stop below the head rather than the right shoulder. This widens risk significantly and typically produces a risk-to-reward ratio below 1:1.5, which weakens the trade's justification. The right shoulder is the most recent structural low before the breakout and the correct reference in every case. A tight stop below the right shoulder, combined with the full measured move as the target, typically produces risk-to-reward ratios between 1:1.5 and 1:2.5 depending on the pair and timeframe. That is a meaningful edge over time.

How to Calculate Your Pip Target

The pip target uses the measured move technique. The calculation projects the pattern's height upward from the breakout point. Here are the three steps:
  1. Measure the distance in pips from the head low to the neckline directly above it.
  2. Identify the exact price where the neckline breakout occurs.
  3. Add the head-to-neckline pip distance to the breakout price.
The formula expressed simply: Target = Breakout Price + (Neckline Price minus Head Price) For example: the head sits at 1.2000, the neckline at 1.2150, and the breakout occurs at 1.2155. The head-to-neckline distance is 150 pips. The target is 1.2155 + 150 = 1.2305. This gives a conservative minimum target. In a strong trending market, price often travels well beyond the measured move projection. In choppy or range-bound conditions, price may stall short of it. The CME Group's educational resources on technical chart patterns document the measured move as the industry-standard projection method across pattern types. Use the projection as a reference and manage the trade as it develops. Partial profit-taking at the measured target with a trailing stop on the remainder is a common approach for maximizing the full move.

Real Forex Examples With Entry, Stop, and Target

Two setups illustrate how the inverse head and shoulders pattern appears in live forex trading across different pairs and timeframes. EUR/USD Daily Chart In a typical EUR/USD daily setup, price forms the left shoulder after a sustained downtrend, drops to the head, then forms the right shoulder above the head's low before breaking the neckline with a strong daily close.
Level Price
Head low 1.0580
Neckline 1.0740
Head-to-neckline distance 160 pips
Breakout point 1.0745
Stop loss (below right shoulder) 1.0620
Pip target 1.0905
The breakout entry at 1.0745 risks 125 pips to the stop at 1.0620. The target at 1.0905 returns 160 pips. Risk-to-reward is 1:1.28. A retest entry at 1.0750 with the same stop reduces the risk-to-reward calculation slightly but adds confirmation that the neckline is holding as support. GBP/USD Four-Hour Chart Consider a GBP/USD setup on the four-hour chart, where price action tends to be more volatile. In this kind of setup, the retest entry often produces cleaner risk-to-reward on this pair.
Level Price
Head low 1.0580
Right shoulder low 1.0635
Neckline 1.0740
Head-to-neckline distance 160 pips
Breakout point 1.0745
Stop loss (below right shoulder) 1.0620
Pip target 1.0905
The retest entry at 1.2625 risks 85 pips. The target at 1.2765 returns 140 pips. Risk-to-reward is 1:1.65. That improvement over a breakout entry comes entirely from waiting for the neckline to confirm as support before entering. Developing the ability to read these setups across timeframes starts with knowing how to read forex charts and identify structural patterns as they form, not after they have already resolved.

Common Mistakes That Cause Failed Trades

Most failed inverse head and shoulders trades trace back to six specific errors. Here they are:
  • Entering before the neckline breaks. Anticipating the breakout inside the right shoulder region is the most costly error. Price frequently dips back toward the head before the real breakout occurs. Early entries get stopped out before the move begins.
  • Identifying the pattern in the wrong context. The inverse head and shoulders requires a clear downtrend before it forms. A three-trough structure inside a sideways range or minor pullback is not a valid reversal setup.
  • Ignoring volume on the breakout candle. A neckline break on thin volume during an off-peak session is a warning, not a signal. Volume is the most important secondary confirmation for the breakout.
  • Drawing the neckline through the wrong swing highs. Connecting the wrong reaction highs shifts the breakout trigger and corrupts the pip target calculation. Take time to identify the precise reaction highs between each trough before drawing the line.
  • Setting the stop below the head. This widens risk without structural justification. The right shoulder low is the correct stop reference in every case.
  • Skipping the broader market context check. A valid pattern during a period of macro currency headwinds needs additional confirmation. The pattern and the macro backdrop must align.
Pairing the inverse head and shoulders with candlestick confirmation signals at the neckline breakout is one of the most practical ways to filter false entries before they cost capital.

Also Read:  Fibonacci Extension Strategy: How to Set Precise Profit Targets

Conclusion

The inverse head and shoulders pattern gives forex traders a clear, structured way to identify when a downtrend is ending. The three-trough structure, the neckline, and the measured move target work together to define where the trend broke down, where momentum shifted, and how far the new move can run. Confirmation is the most important variable. A full candlestick close above the neckline with volume behind it is worth waiting for. The retest entry, where the neckline holds as new support, consistently produces better risk-to-reward setups than entries taken directly on the breakout candle.

Frequently Asked Questions

What Is the Inverse Head and Shoulders Pattern in Forex?

The inverse head and shoulders pattern is a bullish reversal chart formation that appears at the end of a downtrend. It consists of three troughs: a deep middle low (the head) flanked by two shallower lows (the shoulders). A candlestick close above the neckline confirms the pattern and signals the start of an upward move. It is the mirror image of the bearish head and shoulders pattern.

Where Does the Stop Loss Go on an Inverse Head and Shoulders Trade?

The stop loss goes below the right shoulder low. If price breaks the right shoulder after the neckline breakout, the pattern has failed and sellers have reasserted control. Place the stop a few pips below the right shoulder low to account for spread and minor fluctuation. Setting the stop below the head instead widens risk significantly and produces a weaker risk-to-reward ratio.

How Do You Calculate the Pip Target for an Inverse Head and Shoulders?

Measure the distance in pips from the head low to the neckline directly above it. Add that distance to the price where the neckline breakout occurs. That sum is the minimum pip target. For example, a head-to-neckline distance of 150 pips with a breakout at 1.2200 gives a target of 1.2350. This is a conservative projection; strong trends often extend well beyond it.

What Is the Difference Between the Inverse Head and Shoulders and the Regular Head and Shoulders?

The regular head and shoulders appears at the top of an uptrend and signals a bearish reversal. It has three peaks, with the middle peak being the highest. The inverse head and shoulders is its mirror image: it appears at the bottom of a downtrend, has three troughs with the middle trough being the deepest, and signals a bullish reversal. Both patterns use the same measured move calculation applied in opposite directions.

What Timeframes Work Best for the Inverse Head and Shoulders in Forex?

The daily and four-hour charts produce the most reliable inverse head and shoulders setups in forex trading. Patterns on these timeframes reflect meaningful institutional activity and are far less exposed to short-term noise. Lower timeframes such as the one-hour chart can be used for entry timing once the setup is confirmed on the higher timeframe. Patterns on timeframes below one hour carry much higher failure rates.

ezekiel chew asiaforexmentor

About Ezekiel Chew

Ezekiel Chew, founder and head of training at Asia Forex Mentor, is a renowned forex expert, frequently invited to speak at major industry events. Known for his deep market insights, Ezekiel is one of the top traders committed to supporting the trading community. Making six figures per trade, he also trains traders working in banks, fund management, and prop trading firms.

RELATED ARTICLES

Join the Live Event
Get Your Free Ticket Now

I consent to receiving emails and/or text message reminders for this event.

REGISTER FOR THE MASTERCLASS!