
Trading can often feel like piecing together a puzzle where each move the market makes adds another piece to the picture. Over the years, I've learned that some of the best tools for figuring out where the market is headed are the chart patterns it leaves behind. One pattern that has consistently helped me identify potential market reversals is the W pattern, also known as the double bottom pattern. This pattern is straightforward yet powerful, signaling when the market might be gearing up for a change in direction.
Through countless trades, I’ve seen this pattern play out, leading to profitable opportunities. I want to share how you can spot this pattern, trade it effectively, and use some of the strategies that have worked well for me. Whether you're a seasoned trader or just starting, understanding the W pattern can give you an edge.
Let’s break it down and see how you can use the W pattern to your advantage.
What is W Pattern Trading?
W pattern trading is a technique I've leaned on to catch those moments when the market is showing signs of switching from bearish to bullish. The pattern is named after its shape on the chart, which resembles a “W.” This pattern typically appears after the market has experienced a downward trend and indicates that the selling pressure is easing, with buyers beginning to step in.
Also called the double bottom pattern, this setup involves two distinct lows at about the same level, with a peak sitting between them. When this pattern forms, it often suggests that the market might be ready to reverse its direction. Spotting this pattern early has allowed me to enter trades confidently, knowing that I’m catching the market just as it’s starting to turn.
Also Read: How to Trade the Bearish Quasimodo Pattern
What is the W Bottom Pattern?
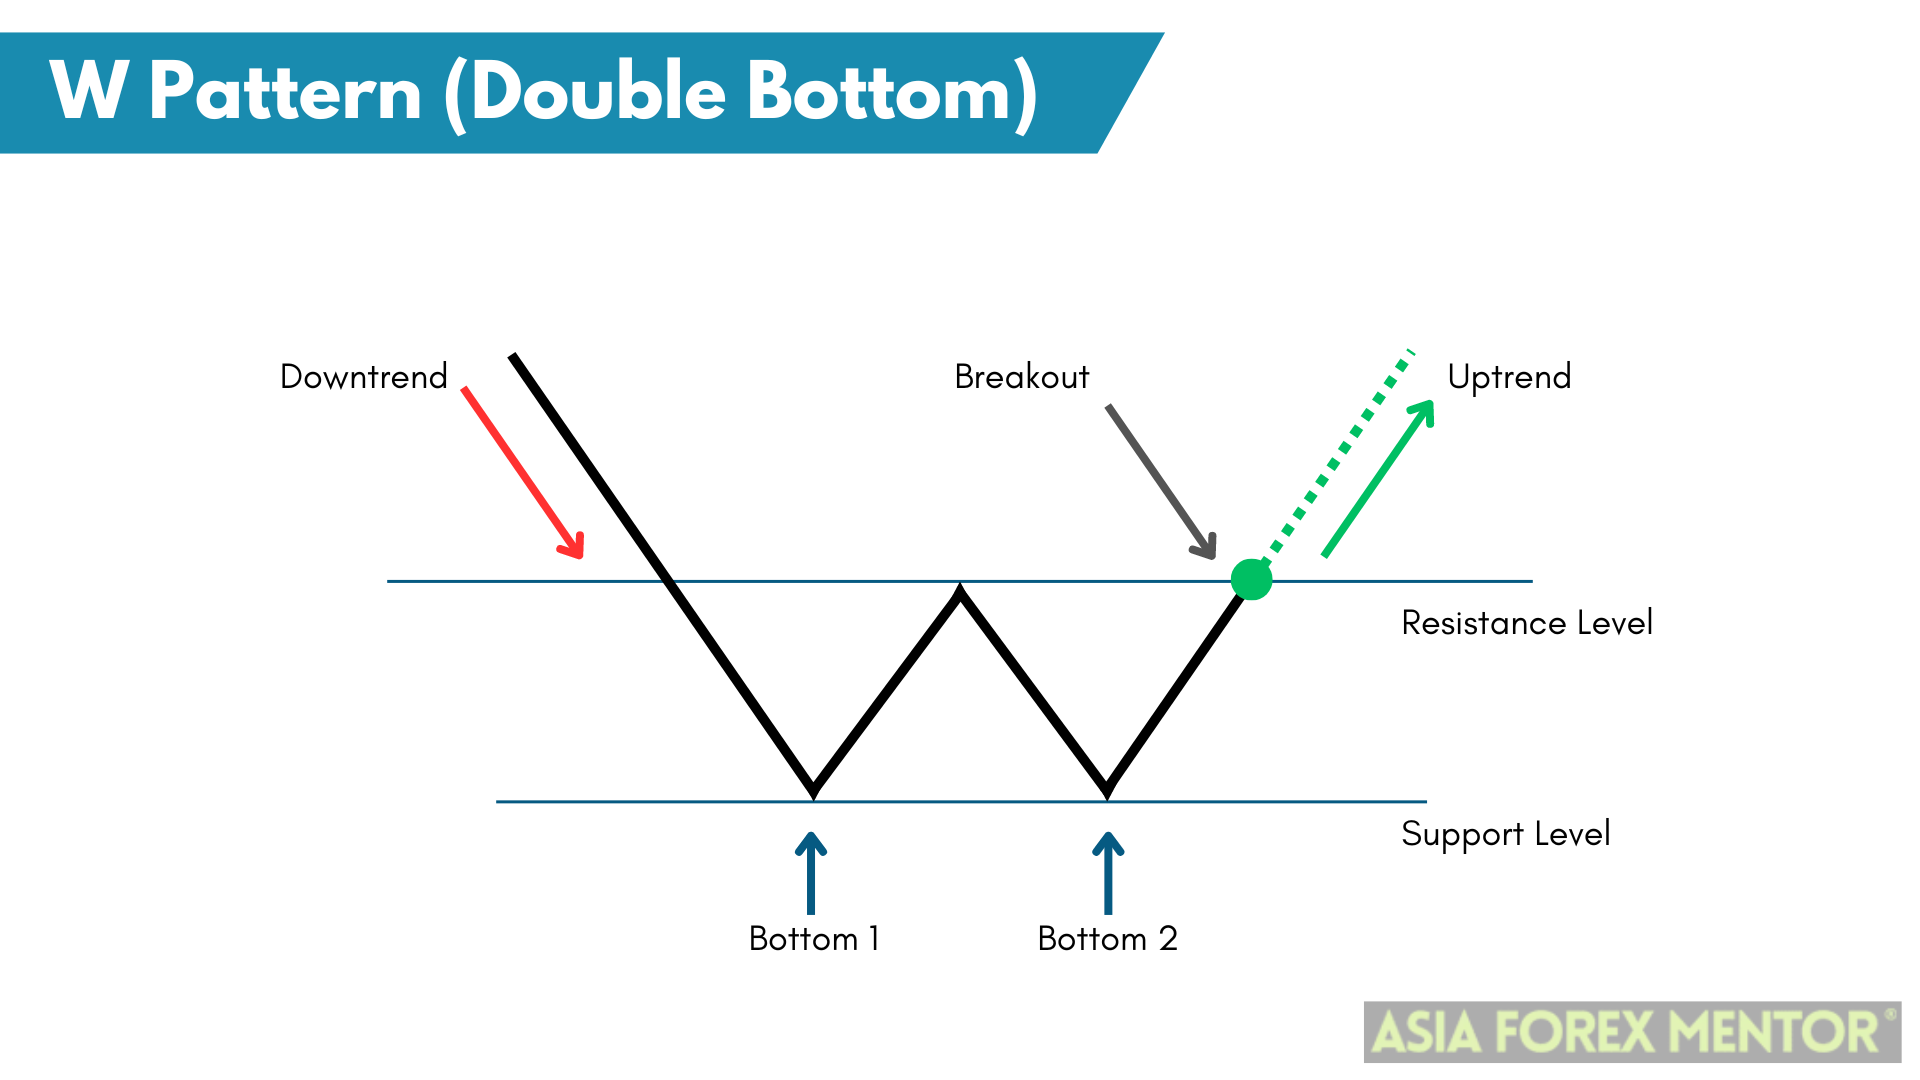
The W bottom pattern, often referred to as the double bottom pattern, is one of those chart setups that can be incredibly useful when trading. It occurs when an asset’s price forms two distinct lows at nearly the same level, with a peak between them. This formation suggests that the asset has found strong support at this price level, hinting that a reversal to an upward trend could be on the horizon.
In my experience, this pattern has shown up time and again across various forex pairs, and when it does, it often signals that the market is about to shift. Spotting this pattern early and confirming it with other indicators can lead to successful trades.
How to Spot the W Bottom Pattern
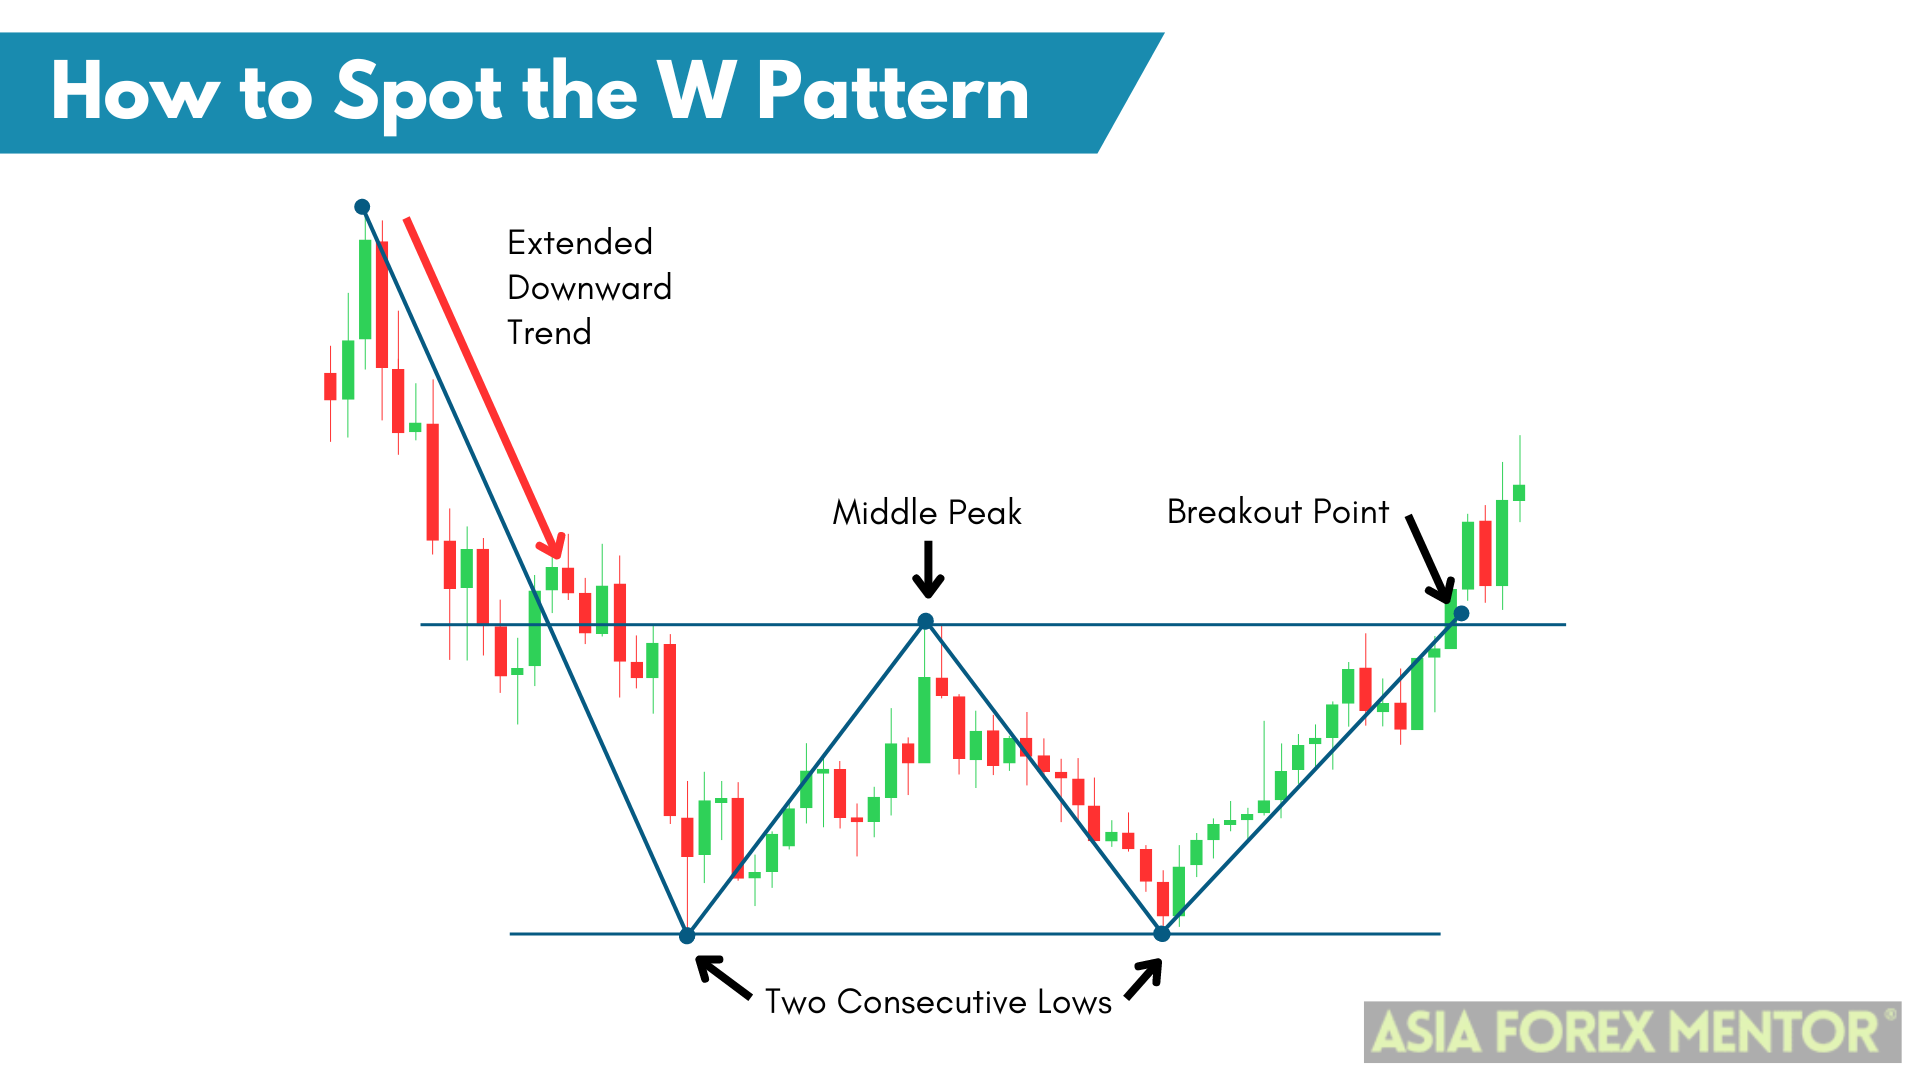
Recognizing the W bottom pattern involves a bit of chart-watching and an understanding of what the market is telling you. Here’s what I usually look for:
- Extended Downward Trend: This pattern typically shows up after a significant drop in price. The market has been moving down, creating the first low.
- Two Consecutive Lows: You’ll notice that the price hits a low, rises to a peak, and then drops again to a second low. Both lows are at about the same level, which shows that the market is testing a support zone.
- Middle Peak: Between these two lows, there’s a peak where the price temporarily rallies before dropping again. This peak is crucial because it shows that buyers are beginning to test the market.
- Breakout Point: The pattern is confirmed when the price breaks above the middle peak after forming the second low. This breakout is often a signal that a new upward trend is starting.
How to Trade the W Bottom Pattern
Trading the W bottom pattern has become a key part of my strategy. Here’s how I go about it:
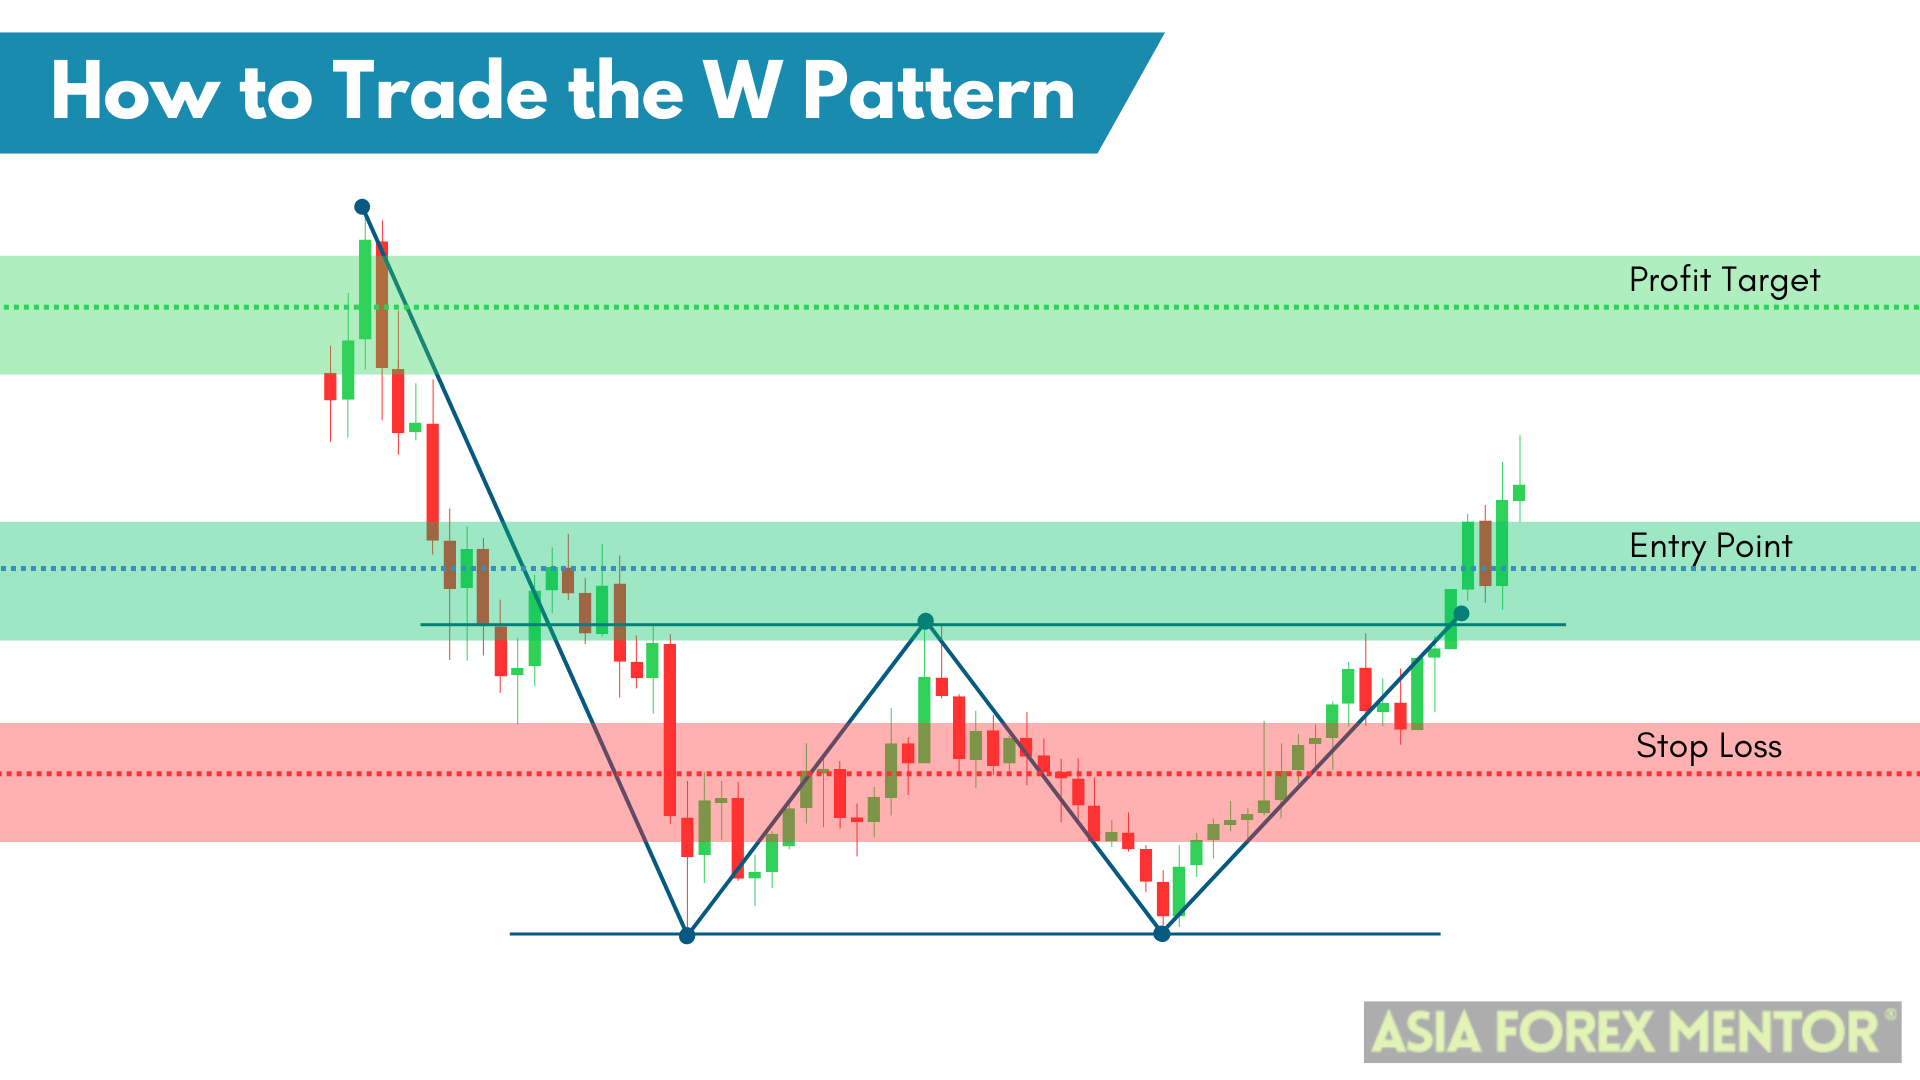
Entry Point: I look to enter a long position when the price breaks above the middle peak of the W pattern. This breakout indicates that the market is shifting from a downward trend to an upward one, making it an ideal point to enter a trade.
Stop Loss: To manage risk, I place a stop loss just below the second low of the pattern. This helps protect against potential losses if the pattern fails and the price continues to decline.
Profit Target: I set my profit target by measuring the distance from the lowest point of the pattern to the middle peak, then projecting that distance upward from the breakout point. This gives me a reasonable target for how far the price might rise.
Pros and Cons of W Pattern Trading
Pros
- W patterns offer reliable signals for trend reversals, which can lead to high-probability trades.
- These patterns provide straightforward guidelines on when to enter and exit a trade, which simplifies decision-making.
- Whether you’re trading forex, stocks, or commodities, W patterns can be applied to identify potential market shifts.
Cons
- Sometimes, the market can reverse after a breakout, leading to potential losses.
- Waiting for the W pattern to fully develop can require patience, especially in fast-moving markets.
Difference Between the Double Bottom and Double Top Pattern
Double Bottom Pattern (W Pattern)
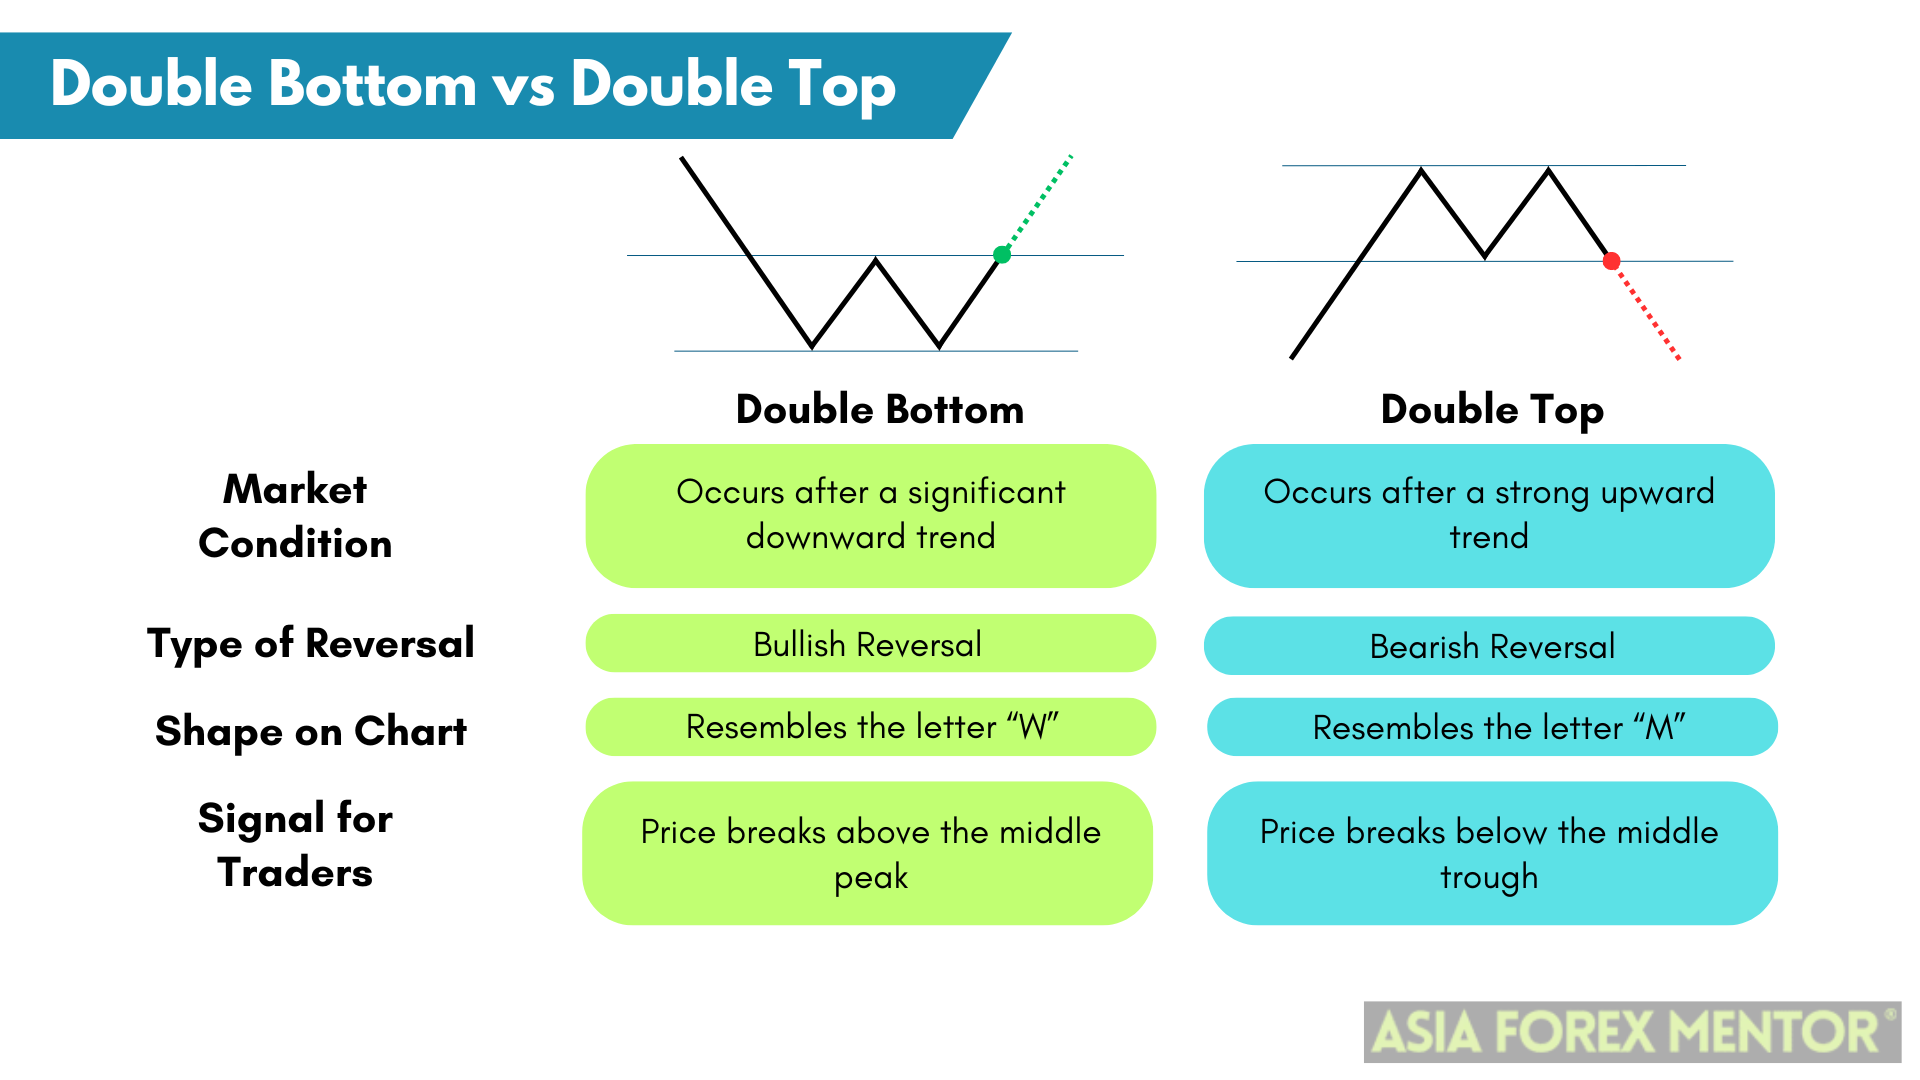
- Market Condition: The double bottom pattern occurs after a significant downward trend. It is a bullish reversal pattern that indicates the potential end of a downtrend and the beginning of an uptrend.
- Shape: This pattern resembles the letter “W,” with two distinct lows at approximately the same level and a peak between them.
- Signal: When the price breaks above the middle peak after forming the second low, it suggests that the market is shifting from bearish to bullish. Traders often see this as an opportunity to enter a long position, anticipating upward movement.
Double Top Pattern (M Pattern)
- Market Condition: The double top pattern appears after a strong upward trend. It is a bearish reversal pattern that signals the potential end of an uptrend and the start of a downtrend.
- Shape: This pattern looks like an inverted “W” or the letter “M,” with two distinct peaks at roughly the same level and a trough between them.
- Signal: When the price breaks below the middle trough after forming the second peak, it indicates that the market is likely to reverse downward. Traders typically use this signal to enter a short position, expecting the price to decline.
Key Differences
- Direction of Reversal: The double bottom pattern is a bullish reversal, while the double top pattern is a bearish reversal.
- Market Trend: The double bottom occurs after a downtrend, suggesting a potential upward reversal. In contrast, the double top happens after an uptrend, indicating a potential downward reversal.
- Trading Strategy: Traders use the double bottom pattern to identify buying opportunities (going long), whereas the double top pattern is used to spot selling opportunities (going short).
Indicators to Use to Confirm the Pattern
To increase the chances of a successful trade, I often use additional technical indicators to confirm the W patterns:
- Moving Averages: These can help determine the overall trend direction and confirm whether a breakout is likely to hold.
- Relative Strength Index (RSI): RSI is helpful for identifying overbought or oversold conditions, providing additional insight into whether a reversal is likely.
- Volume: A surge in volume during a breakout strengthens the case that the pattern is valid.
- MACD: The Moving Average Convergence Divergence (MACD) indicator is useful for confirming momentum shifts, especially during a breakout.
Tips for Trading W Patterns
1. Be Patient: W patterns can take time to fully develop, so patience is key. Don’t rush into a trade before the pattern is complete and confirmed.
2. Use Other Indicators: While W patterns can be powerful on their own, confirming them with additional indicators like RSI, volume, or MACD can increase your chances of success.
3. Set Clear Targets: Determine your entry, stop loss, and profit target levels before entering the trade. This helps remove emotion from your decision-making and ensures you’re trading with a plan.
4. Practice on Demo Accounts: If you’re new to trading W patterns, consider practicing on a demo account first. This allows you to get comfortable with the pattern without risking real money.
5. Stay Disciplined: Stick to your trading plan and don’t let emotions drive your decisions. It’s easy to get caught up in the moment, but discipline is what separates successful traders from the rest.
Common Mistakes to Avoid
1. Entering Too Early: One of the most common mistakes is jumping into a trade before the pattern is fully formed and confirmed. This can lead to losses if the market doesn’t follow through as expected.
2. Ignoring Stop Losses: Always use a stop loss to protect your capital. Ignoring this critical step can lead to significant losses if the market moves against you.
3. Overtrading: Just because you spot a W pattern doesn’t mean you should trade every single one. Quality over quantity is key. Look for patterns that meet all your criteria and have strong confirmation signals.
4. Neglecting Market Conditions: W patterns are powerful, but they aren’t foolproof. Always consider the broader market conditions before making a trade. A strong trend or significant news event can override a pattern, leading to unexpected results.
Conclusion
W pattern trading has been a reliable method in my trading toolkit, helping me consistently identify potential trend reversals. Whether you’re trading the W bottom or W top pattern, this approach can give you a clearer picture of where the market might be headed. By learning how to spot these patterns and using the strategies outlined here, you can increase your chances of making successful trades.
Remember to be patient, use other indicators to confirm the pattern, and always have a clear plan before entering a trade. With practice and discipline, W pattern trading can become a valuable part of your trading strategy.
Also Read: How to Trade the Bullish Tri-Star Pattern
FAQs
1. What is the W Pattern in Trading?
The W Pattern, or Double Bottom, is a bullish reversal pattern that resembles the letter “W.” It forms at the end of a downtrend and signals that sellers are losing control, potentially leading to a price reversal upward. The pattern consists of two roughly equal lows (the “bottoms”) separated by a peak (the “middle”), with a breakout above the peak confirming the signal.
2. How Does the W Pattern Differ from Other Reversal Patterns?
Unlike the Head and Shoulders Pattern (a bearish reversal), the W Pattern is specifically bullish and focuses on two equal lows rather than three distinct points. It's similar to the Double Bottom but is named for its “W” shape. Compared to a Triple Bottom, it has only two lows, making it quicker to form.
For comparisons, refer to Head and Shoulders Pattern or Inverted Head and Shoulders Pattern on Asia Forex Mentor, which highlight key differences in structure and implications.
3. What are the Key Components of a Valid W Pattern?
A valid W Pattern includes:
- Two Lows: Approximately equal in price, forming the “W” base (ideally within 3-4% of each other).
- Neckline: A resistance level connecting the highs between the lows (the peak of the “W”).
- Volume Confirmation: Decreasing volume on the second low and increasing on the breakout.
- Breakout: Price closes above the neckline on higher volume.
To learn more about identifying these on charts, explore How to Read Forex Charts for foundational skills.
4. In Which Markets Can the W Pattern Be Applied?
The W Pattern is versatile and works in forex (e.g., EUR/USD pairs), stocks (e.g., tech or blue-chip), cryptocurrencies (e.g., Bitcoin during recoveries), commodities, and indices. It's most reliable in trending markets with sufficient liquidity to avoid false signals.
For forex-specific applications, see Price Action Trading, which discusses patterns like the W in currency pairs.
5. How Do You Identify a W Pattern on a Chart?
To spot a W Pattern:
- Look for a downtrend ending in the first low.
- Wait for a moderate rally forming the middle peak.
- Identify the second low near the first (ideally after 3-13 weeks or bars).
- Confirm with a breakout above the neckline.
Use tools like candlestick charts for precision. Asia Forex Mentor's Candlestick Patterns Cheat Sheet can help confirm the lows with bullish candles like hammers.
6. What Timeframes Are Best for Trading the W Pattern?
The W Pattern performs well on daily and weekly charts for swing trading, but it can appear on hourly or 4-hour charts for day traders. Shorter timeframes (e.g., 15-minute) may produce more signals but with higher false positives due to noise.
For intraday strategies, review Intraday Trading Indicators to combine with W Patterns.
7. What is the Typical Success Rate of the W Pattern?
Studies suggest the W Pattern has a 70-80% success rate in confirming bullish reversals when validated by volume and a neckline breakout, though this varies by market conditions. Backtesting is essential—false breakouts occur in ranging markets.
Learn backtesting techniques from Backtesting Trading Strategies on Asia Forex Mentor.
8. How Do You Calculate the Price Target for a W Pattern?
The profit target is measured from the neckline to the lowest point of the pattern (the “W” depth), then projected upward from the breakout point. For example, if the depth is 100 pips, expect a 100-pip move post-breakout. Use Fibonacci extensions for refinements.
Incorporate Fibonacci Retracement tools for accurate projections, as explained in Asia Forex Mentor's resources.
9. What Entry Strategies Work Best with the W Pattern?
- Breakout Entry: Buy when price closes above the neckline on increased volume.
- Pullback Entry: Wait for a retest of the neckline (now support) before entering.
- Risk 1-2% of capital per trade.
For entry signals, pair with Support and Resistance in Forex.
10. Where Should You Place Your Stop-Loss When Trading a W Pattern?
Place the stop-loss just below the second low (or the pattern's lowest point) to protect against failure. This allows for a risk-reward ratio of at least 1:2. Adjust based on volatility using ATR.
Refer to Average True Range (ATR) Indicator for dynamic stop placement.
11. How Does Volume Play a Role in Confirming the W Pattern?
Volume should decline during the formation (indicating weakening sellers) and surge on the breakout, confirming buyer conviction. Low volume breakouts often fail.
Explore volume analysis in Volume Price Analysis.
12. Can the W Pattern Fail, and How Do You Avoid False Signals?
Yes, failures (e.g., “fakeouts”) happen in choppy markets or without volume confirmation. Avoid by:
- Requiring a clean downtrend prior.
- Using multiple timeframes for alignment.
- Combining with indicators like RSI (oversold at lows).
See Divergence Cheat Sheet for RSI integration to filter signals.
13. How Does the W Pattern Compare to the M Pattern (Double Top)?
The W (bullish) is the inverse of the M (bearish Double Top). Both signal reversals, but W indicates buying pressure after lows, while M shows selling after highs. Trade W for longs, M for shorts.
Compare with Bearish Divergence for M Pattern insights.
14. What Indicators Enhance W Pattern Trading?
- Moving Averages: Confirm uptrend post-breakout (e.g., price above 50-day MA).
- RSI/MACD: Look for bullish divergence at lows.
- Bollinger Bands: Breakout from lower band.
Detailed strategies in Bollinger Bands Forex and MACD Histogram.
15. Is the W Pattern Effective in Forex Trading?
Yes, especially in major pairs like GBP/USD during economic recoveries. It's reliable due to high liquidity but watch for news events that can invalidate it.
For forex examples, visit Best Forex Strategy for Consistent Profits.
16. How to Trade the W Pattern in Cryptocurrency Markets?
In crypto (e.g., BTC/USD), the W often forms after flash crashes. Enter on breakout with tight stops due to volatility. Use it with Crypto Trading Strategies.
17. What Role Does Market Context Play in W Pattern Reliability?
The pattern is strongest after a prolonged downtrend in a bullish overall market (e.g., rising 200-day MA). In bear markets, it may fail as a continuation rather than reversal.
Contextual analysis in Market Conditions.
18. How to Backtest W Pattern Trades?
Use historical data on platforms like MT4/MT5. Test 100+ instances, tracking win rate, average gain/loss. Adjust for commissions.
Guidance from Strategy Tester.
19. Are There Variations of the W Pattern?
Yes, like an imperfect W (unequal lows) or Extended W (deeper second low). Treat imperfect ones cautiously, requiring stronger confirmation.
Related: Harmonic Patterns.
20. How Does Psychology Influence the W Pattern Formation?
The first low scares sellers, the rally tests resolve, and the second low exhausts them, leading to FOMO buying on breakout. Understanding this aids timing.
Behavioral insights in Forex Trading Psychology.
21. What Common Mistakes Do Traders Make with W Patterns?
- Entering too early without breakout.
- Ignoring volume.
- Poor risk management (wide stops).
- Overtrading in ranging markets.
Avoid via Trading Plan.
22. Can Software or Tools Automate W Pattern Detection?
Yes, platforms like TradingView or MT5 have scanners for Double Bottoms. Custom scripts in Pine Script can alert on formations.
Tools overview in Best Technical Indicators for Day Trading.
23. How Does the W Pattern Perform in Volatile Markets?
It shines in volatile environments (e.g., post-news) but requires tighter stops. Use with Volatility Indicator.
24. What Books or Resources Recommend for Learning W Patterns?
- “Encyclopedia of Chart Patterns” by Thomas Bulkowski.
- Online: Asia Forex Mentor's Forex Patterns guide.
25. How to Combine W Pattern with Other Patterns?
Pair with bullish flags for continuation or triangles for confirmation. Example: W followed by a bull flag signals strong uptrend.
See Bull Flag, Bear Flag, and Pennants.
26. Is the W Pattern Suitable for Scalping?
Rarely, due to its multi-bar formation. Better for swing trading (holding days to weeks).
Scalping alternatives in Scalping Forex.
27. How Do Economic Events Affect W Pattern Validity?
High-impact news (e.g., NFP) can accelerate breakouts or cause failures. Trade post-event for confirmation.
Event trading in NFP Forex.
28. What is the Risk-Reward Ratio for W Pattern Trades?
Aim for 1:2 or better—risk 1% for 2%+ reward. Track with Risk-Reward Ratio.
29. How to Journal W Pattern Trades Effectively?
Record entry/exit, rationale, outcome. Review for patterns in successes/failures.
Tools in Trading Journal.
30. Where Can I Practice Trading W Patterns Without Risk?
Use demo accounts on brokers like those reviewed on Asia Forex Mentor. Simulate with historical data.
Start with Demo to Live Trading.